

determine the code that will be added that will yield or display the equation of y( equation of the graph). I will automatically give a
determine the code that will be added that will yield or display the equation of y( equation of the graph). I will automatically give a dislike if the you can't provide the code that will display the equation.
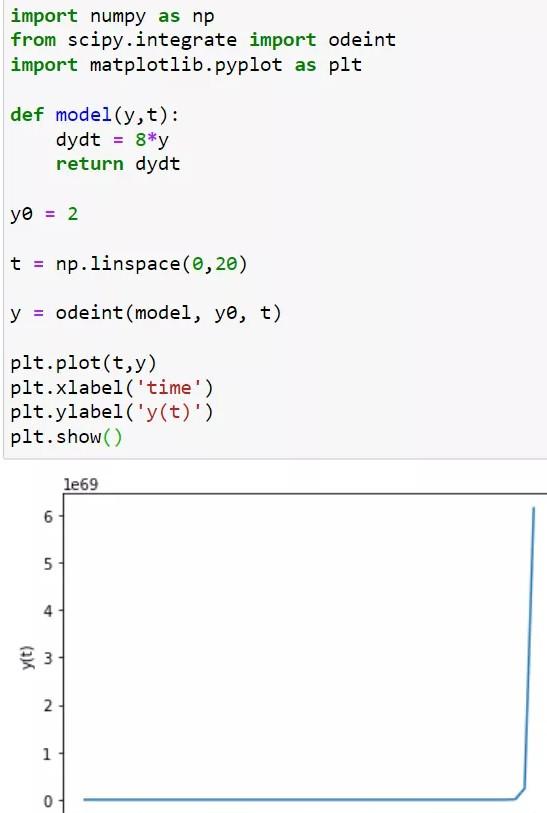
import numpy as np from scipy.integrate import odeint import matplotlib.pyplot as plt def model(y,t): dydt = 8*y return dydt yo = 2 t = np.linspace(0,20) y = odeint(model, yo, t) plt.plot(t,y) plt.xlabel('time') plt.ylabel('y(t)') plt.show() le69 6 5 5 4 y(t) 3 2 1 1 0Step by Step Solution
There are 3 Steps involved in it
Step: 1

See step-by-step solutions with expert insights and AI powered tools for academic success
Step: 2

Step: 3
Ace Your Homework with AI
Get the answers you need in no time with our AI-driven, step-by-step assistance
Get Started
Authors: Shashi Shekhar, Sanjay Chawla
1st Edition
0130174807, 978-0130174802