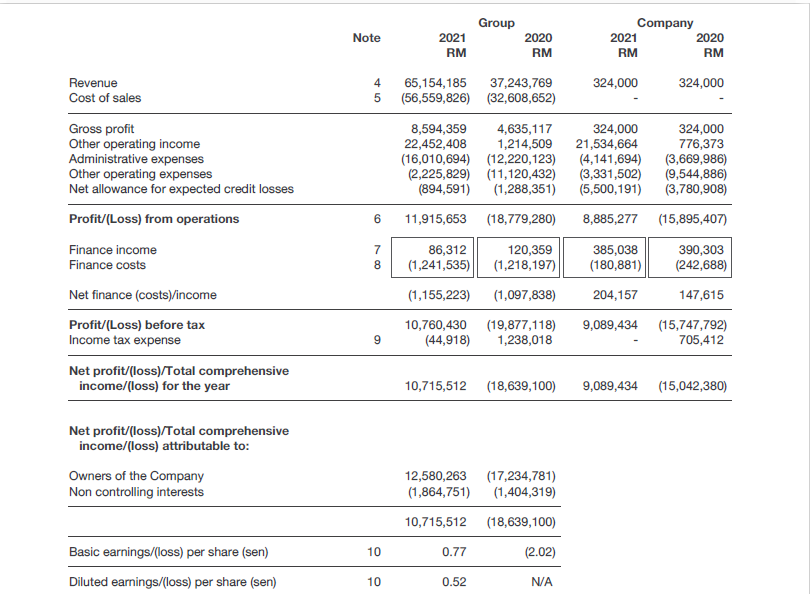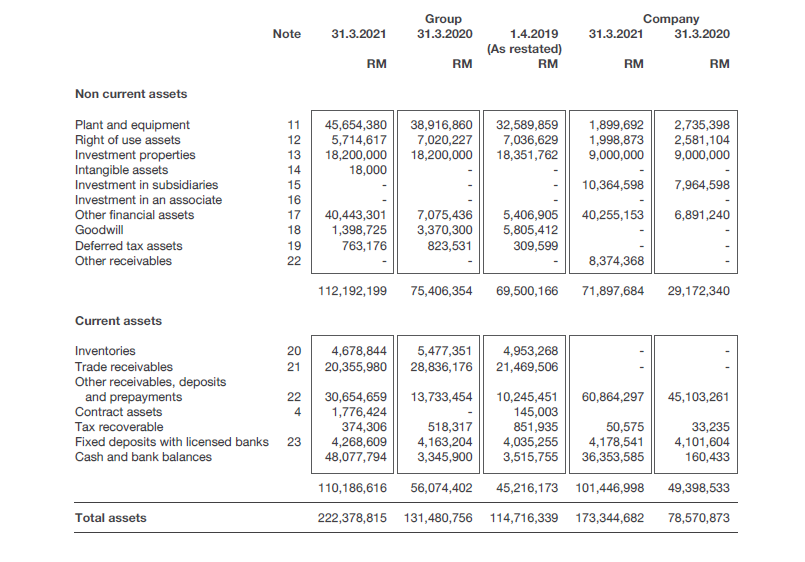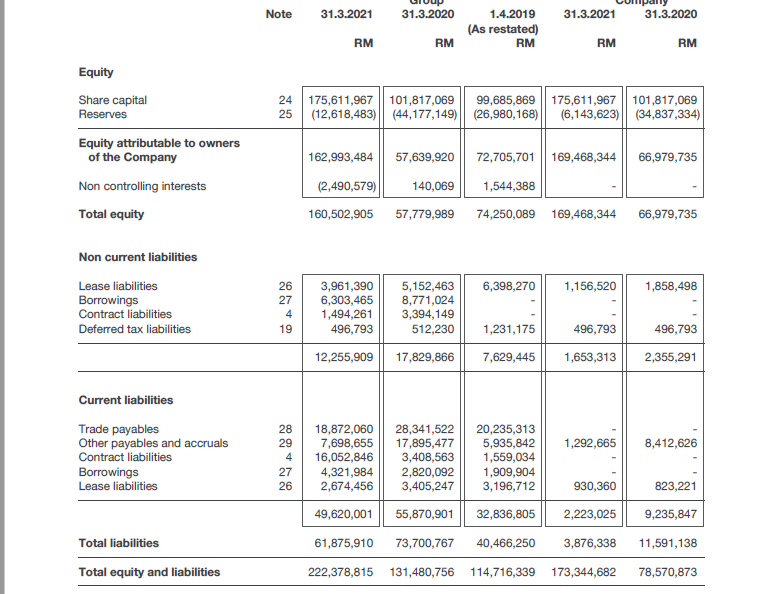


- Determine the current level of debt, ROCE in percentage.
- Determine Net income (without leverage)
- Determine ROCE (without leverage)
- By considering ROCE with and without leverage, does leverage (from long-term debt) benefit your companys shareholders?
- Compute your companys NOPAT and RNOA (use ending NOA).
- Again, by considering ROCE and RNOA, does the use of leverage benefit your companys shareholders?
- Compute the percentage of financial leverage (Noncurrent liabilities/Equity)
- Compute ROCE using its disaggregation formula (RNOA +LEV + Spread)
- Compute the actual value of favourable effect of financial leverage
Group Note 2021 RM 2020 RM Company 2021 2020 RM RM 324,000 324,000 Revenue Cost of sales 4 65,154,185 37,243,769 5 (56,559,826) (32,608,652) Gross profit Other operating income Administrative expenses Other operating expenses Net allowance for expected credit losses 8,594,359 4,635,117 22,452,408 1,214,509 (16,010,694) (12,220,123) (2,225,829) (11,120,432) (894,591) (1,288,351) 324,000 21,534,664 (4,141,694) (3,331,502) (5,500,191) 324,000 776,373 (3,669,986) (9,544,886) (3,780,908) 6 11,915,653 (18,779,280) 8,885,277 (15,895,407) Profit/(Loss) from operations Finance income Finance costs Net finance costs)/income 7 8 86,312 (1,241,535) 120,359 (1,218,197) (1,097,838) 385,038 (180,881) 390,303 (242,688) 147,615 (1,155,223) 204,157 10,760,430 (19,877,118) (44,918) 1,238,018 9,089,434 (15,747,792) 705,412 9 Profit/(Loss) before tax Income tax expense Net profit/(loss)/Total comprehensive income/(loss) for the year 10,715,512 (18,639,100) 9,089,434 (15,042,380) Net profit/(loss)/Total comprehensive income/(loss) attributable to: Owners of the Company Non controlling interests 12,580,263 (1,864,751) (17,234,781) (1,404,319) 10,715,512 (18,639,100) 10 0.77 (2.02) Basic earnings/(loss) per share (sen) Diluted earnings/(loss) per share (sen) 10 0.52 NA Group 31.3.2020 31.3.2021 Company 31.3.2021 31.3.2020 Note 1.4.2019 (As restated) RM RM RM RM RM Non current assets 45,654,380 5,714,617 18,200,000 18,000 38,916,860 7,020,227 18,200,000 32,589,859 7,036,629 18,351,762 1,899,692 1,998,873 9,000,000 2,735,398 2,581,104 9,000,000 Plant and equipment Right of use assets Investment properties Intangible assets Investment in subsidiaries Investment in an associate Other financial assets Goodwill Deferred tax assets Other receivables 11 12 13 14 15 16 17 18 19 22 10,364,598 7,964,598 40,255,153 6,891,240 40,443,301 1,398,725 763,176 7,075,436 3,370,300 823,531 5,406,905 5,805,412 309,599 8,374,368 112,192,199 75,406,354 69,500,166 71,897,684 29,172,340 Current assets 20 21 4,678,844 20,355,980 5,477,351 28,836,176 4,953,268 21,469,506 Inventories Trade receivables Other receivables, deposits and prepayments Contract assets Tax recoverable Fixed deposits with licensed banks Cash and bank balances 22 4 13,733,454 60,864,297 45,103,261 30,654,659 1,776,424 374,306 4,268,609 48,077,794 10,245,451 145,003 851,935 4,035,255 3,515,755 518,317 4,163,204 3,345,900 23 50,575 4,178,541 36,353,585 33,235 4,101,604 160,433 110,186,616 56,074,402 45,216,173 101,446,998 49,398,533 Total assets 222,378,815 131,480,756 114,716,339 173,344,682 78,570,873 Note 31.3.2021 31.3.2020 31.3.2021 31.3.2020 1.4.2019 (As restated) RM RM RM RM RM Equity Share capital Reserves 24 175,611,967 || 101,817,069 99,685,869 175,611,967 || 101,817,069 25 (12,618,483)|| (44,177,149) || (26,980,168) (6,143,623) || (34,837,334) Equity attributable to owners of the Company 162,993,484 57,639,920 72,705,701 | 169,468,344 66,979,735 (2,490,579) 140,069 Non controlling interests Total equity 1,544,388 74,250,089 169,468,344 160,502,905 57,779,989 66,979,735 Non current liabilities 6,398,270 1,156,520 1,858,498 Lease liabilities Borrowings Contract liabilities Deferred tax liabilities 26 27 4 19 3,961,390 6,303,465 1,494,261 496,793 5,152,463 8,771,024 3,394,149 512,230 1,231,175 496,793 496,793 12,255,909 17,829,866 7,629,445 1,653,313 2,355,291 Current liabilities Trade payables Other payables and accruals Contract liabilities Borrowings Lease liabilities 1,292,665 8,412,626 28 29 4 27 26 18,872,060 7,698,655 16,052,846 4,321,984 2,674,456 28,341,522 17,895,477 3,408,563 2,820,092 3,405,247 20,235,313 5,935,842 1,559,034 1,909,904 3,196,712 930,360 823,221 49,620,001 55,870,901 32,836,805 2,223,025 9,235,847 61,875,910 73,700,767 40,466,250 3,876,338 11,591,138 Total liabilities Total equity and liabilities 222,378,815 131,480,756 114,716,339 173,344,682 78,570,873 Group Note 2021 RM 2020 RM Company 2021 2020 RM RM 324,000 324,000 Revenue Cost of sales 4 65,154,185 37,243,769 5 (56,559,826) (32,608,652) Gross profit Other operating income Administrative expenses Other operating expenses Net allowance for expected credit losses 8,594,359 4,635,117 22,452,408 1,214,509 (16,010,694) (12,220,123) (2,225,829) (11,120,432) (894,591) (1,288,351) 324,000 21,534,664 (4,141,694) (3,331,502) (5,500,191) 324,000 776,373 (3,669,986) (9,544,886) (3,780,908) 6 11,915,653 (18,779,280) 8,885,277 (15,895,407) Profit/(Loss) from operations Finance income Finance costs Net finance costs)/income 7 8 86,312 (1,241,535) 120,359 (1,218,197) (1,097,838) 385,038 (180,881) 390,303 (242,688) 147,615 (1,155,223) 204,157 10,760,430 (19,877,118) (44,918) 1,238,018 9,089,434 (15,747,792) 705,412 9 Profit/(Loss) before tax Income tax expense Net profit/(loss)/Total comprehensive income/(loss) for the year 10,715,512 (18,639,100) 9,089,434 (15,042,380) Net profit/(loss)/Total comprehensive income/(loss) attributable to: Owners of the Company Non controlling interests 12,580,263 (1,864,751) (17,234,781) (1,404,319) 10,715,512 (18,639,100) 10 0.77 (2.02) Basic earnings/(loss) per share (sen) Diluted earnings/(loss) per share (sen) 10 0.52 NA Group 31.3.2020 31.3.2021 Company 31.3.2021 31.3.2020 Note 1.4.2019 (As restated) RM RM RM RM RM Non current assets 45,654,380 5,714,617 18,200,000 18,000 38,916,860 7,020,227 18,200,000 32,589,859 7,036,629 18,351,762 1,899,692 1,998,873 9,000,000 2,735,398 2,581,104 9,000,000 Plant and equipment Right of use assets Investment properties Intangible assets Investment in subsidiaries Investment in an associate Other financial assets Goodwill Deferred tax assets Other receivables 11 12 13 14 15 16 17 18 19 22 10,364,598 7,964,598 40,255,153 6,891,240 40,443,301 1,398,725 763,176 7,075,436 3,370,300 823,531 5,406,905 5,805,412 309,599 8,374,368 112,192,199 75,406,354 69,500,166 71,897,684 29,172,340 Current assets 20 21 4,678,844 20,355,980 5,477,351 28,836,176 4,953,268 21,469,506 Inventories Trade receivables Other receivables, deposits and prepayments Contract assets Tax recoverable Fixed deposits with licensed banks Cash and bank balances 22 4 13,733,454 60,864,297 45,103,261 30,654,659 1,776,424 374,306 4,268,609 48,077,794 10,245,451 145,003 851,935 4,035,255 3,515,755 518,317 4,163,204 3,345,900 23 50,575 4,178,541 36,353,585 33,235 4,101,604 160,433 110,186,616 56,074,402 45,216,173 101,446,998 49,398,533 Total assets 222,378,815 131,480,756 114,716,339 173,344,682 78,570,873 Note 31.3.2021 31.3.2020 31.3.2021 31.3.2020 1.4.2019 (As restated) RM RM RM RM RM Equity Share capital Reserves 24 175,611,967 || 101,817,069 99,685,869 175,611,967 || 101,817,069 25 (12,618,483)|| (44,177,149) || (26,980,168) (6,143,623) || (34,837,334) Equity attributable to owners of the Company 162,993,484 57,639,920 72,705,701 | 169,468,344 66,979,735 (2,490,579) 140,069 Non controlling interests Total equity 1,544,388 74,250,089 169,468,344 160,502,905 57,779,989 66,979,735 Non current liabilities 6,398,270 1,156,520 1,858,498 Lease liabilities Borrowings Contract liabilities Deferred tax liabilities 26 27 4 19 3,961,390 6,303,465 1,494,261 496,793 5,152,463 8,771,024 3,394,149 512,230 1,231,175 496,793 496,793 12,255,909 17,829,866 7,629,445 1,653,313 2,355,291 Current liabilities Trade payables Other payables and accruals Contract liabilities Borrowings Lease liabilities 1,292,665 8,412,626 28 29 4 27 26 18,872,060 7,698,655 16,052,846 4,321,984 2,674,456 28,341,522 17,895,477 3,408,563 2,820,092 3,405,247 20,235,313 5,935,842 1,559,034 1,909,904 3,196,712 930,360 823,221 49,620,001 55,870,901 32,836,805 2,223,025 9,235,847 61,875,910 73,700,767 40,466,250 3,876,338 11,591,138 Total liabilities Total equity and liabilities 222,378,815 131,480,756 114,716,339 173,344,682 78,570,873


