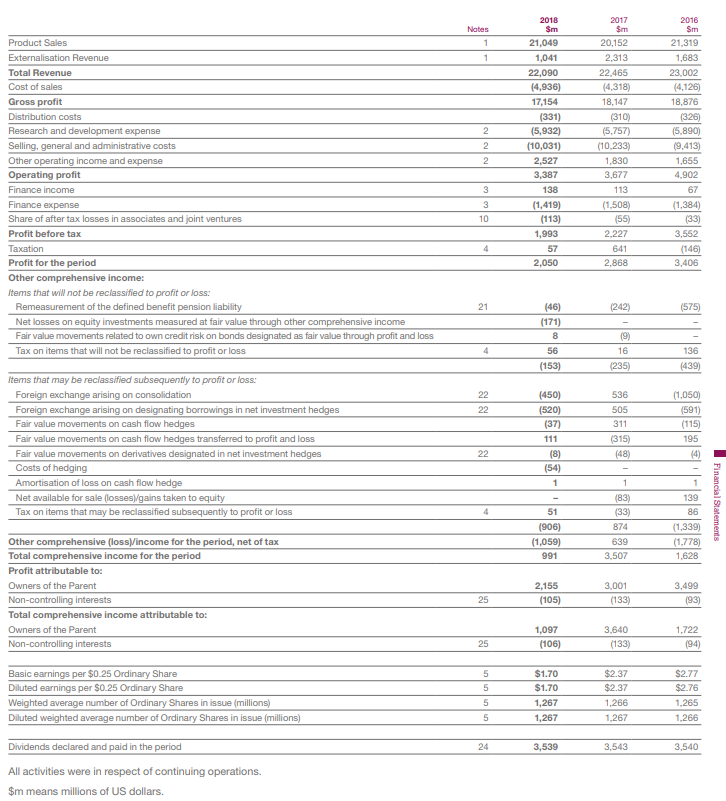
- Determine the following:
- Total sales
- Cost of goods sold
- Gross Margin
- Gross Margin by Percentage
- Average inventory
- Inventory turns
- GMROII
- Turn Earn Index
- State how you would recommend they set their safety stock levels?
2018 Smi 2017 Sm 2016 Sm Nates Product Sales 21,049 20,152 21,319 Externalisation Revenue 1,041 2,313 1,683 Total Revenue 22,090 22,465 23,002 Cost of sales (4,936) (4,318) (4,126) Gross profit 17,154 18,147 18,876 Distribution costs (331) (310) (326) Research and development expense 2 (5,932) (5,757) (5,890) (10,233) Selling, general and administrative costs 2 (10,031) (9,413) Other operating income and expense 2 2,527 1,830 1,655 Operating profit 3,387 3,677 4,902 Finance income 3 138 113 67 (1,508) Finance expense 3 (1,419) (1,384) Share of after tax losses in associates and joint ventures 10 (113) (55) (33) Profit before tax 1,993 2,227 3,552 Taxation 57 641 (146) Profit for the period 2,050 2,868 3,406 Other comprehensive income: Items that will not be reclassified to profit or loss: Remeasurement of the defined benefit pension liability 21 (46) (242) (575) Net losses on equity investments measured at fair value through other comprehensive income (171) Fair value movements related to own credit risk on bonds designated as fair value through profit and loss 8 (9) 56 Tax on items that will not be reclassified to profit or loss 4 16 136 (153) (235) (439) Items that may be reclassified subsequently to profit or loss Foreign exchange arising on consolidation 22 (450) 536 (1,050) Foreign exchange arising on designating borrowings in net investment hedges 22 (520) 505 (591) Fair value movements on cash flow hedges (37) 311 (115) Fair value movements on cash flow hedges transferred to profit and loss 111 (315) 195 Fair value movements on derivatives designated in net investment hedges Costs of hedging 22 (8) (48) (4) (54) Amortisation of loss on cash flow hedge 1 Net available for sale (losses)/gains taken to equity (83) 139 Tax on items that may be reclassified subsequently to profit or loss 51 (33) 86 (906) 874 (1,339) Other comprehensive (loss)/income for the period, net of tax (1,059) 639 (1,778) Total comprehensive income for the period 991 3.507 1,628 Profit attributable to: Owners of the Parent 2,155 3,001 3,499 Non-controlling interests 25 (105) (133) (93) Total comprehensive income attributable to: Owners of the Parent 1,097 3,640 1,722 Non-controlling interests 25 (106) (133) (94) Basic earnings per $0.25 Ordinary Share $1.70 $2.37 $2.77 Diluted earnings per $0.25 Ordinary Share $1.70 $2.37 $2.76 Weighted average number of Ordinary Shares in issue (millions) 5 1,267 1,266 1,265 Diluted weighted average number of Ordinary Shares in issue (millions) 5 1,267 1,267 1,266 Dividends declared and paid in the period 24 3,539 3,543 3,540 All activities were in respect of continuing operations. $m means millions of US dollars. Financial Statements


