

Question
Determine the intrinsic value of the selected company using a DCF valuation model. Determine if the company is overvalued, undervalued or fairly valued based on
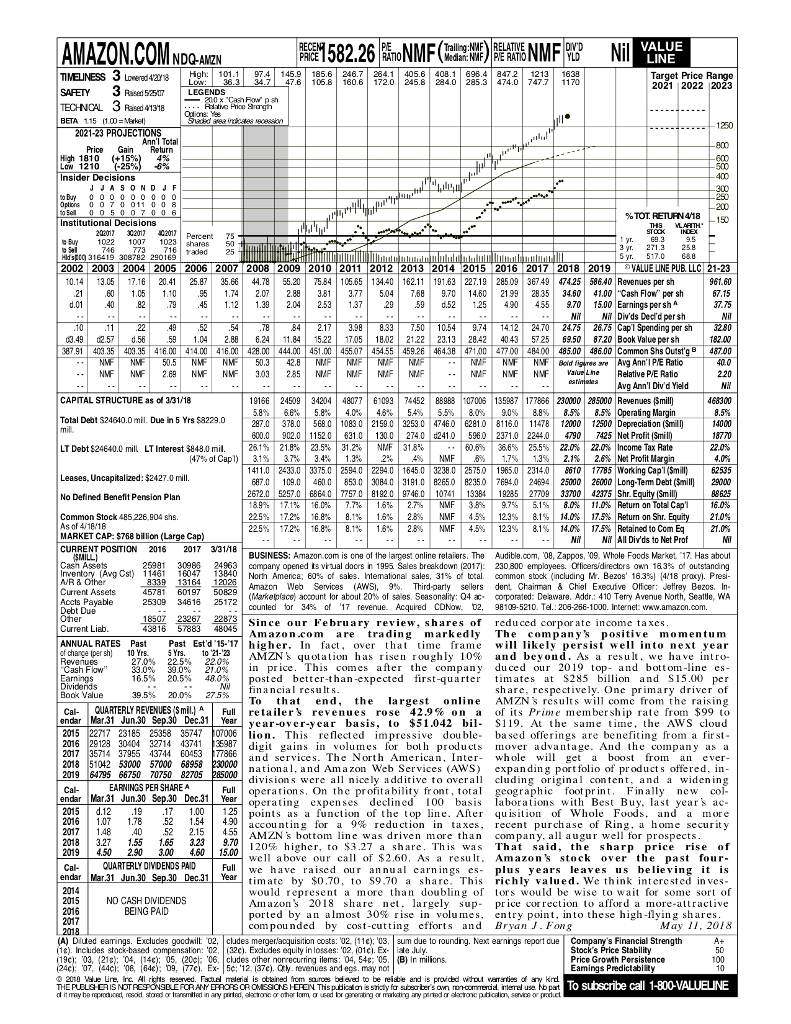 Determine the intrinsic value of the selected company using a DCF valuation model. Determine if the company is overvalued, undervalued or fairly valued based on your calculations. The important aspects of the report will be the method and login you use to come up with your "accurate" valuation. Once you have your valuation, be sure to compare and contrast your valuation vs. that of the current market.
COMPANY: AMZN
VALUE AMAZON.COM NDQ-AIZN 97.4 145.9 185.6 246.7 284.405.6 408.1 698.4 847 2 1213 1638 47.6 106.8 160.6 172.0 245.8 284.0 285.3 474.0 747.7 1170 Target Price Ra 2021 2022 2023 nge Rased 5250 LEGENDS as r pgh 2021-23 PROJECTIONS Price Gain Return 25% Insider Decisions Institutional Decisions 01 50 746 773716 25 dpCo 316419 308782 2901 2002 2003 2004 2005 2006 2007 2008 2009 2010 2011 2012 2013 2014 2015 2016 2017 2018 2019| VALUE UNE PUBLLC 21-23 0.14 13.05.1620.41 25.8735.6844.7855.207584105.65 134.40 162.11 191.63 227.192850936749 47425 586.40 Revenues per sh 21 0 105 1.105 742.07 2.88 383.77 504 768 9.70 14.60 219928353460 41.00 Cash Flow" per sh d.01 40 879 45 132.04 253 132959 d.525 490 455 9.70 15.00 Earnings persh NiNi Div'ds Ded'd per sh 2475 26.75 Cap sh 03.4902.57 .56591.02.88 6.24 11.84 15.221705 18.02 21.22 23,13 2842 4043 525 69.50 87.20 Book Value per sh 387.91 403.35 403.35 416.00 414.00 416.00 428.00 444.00 451.00 455.07 454.55 459.26 46438 471.00 47700 48400 485.00 486.00 Common Shs Outst'g 48700 1 P/E Ratio MFI NUF NUF | VaiudLhe Relative PE Ratio 220 Avg Ann'l Div'd Yield CAPITAL STRUCTURE as of 331/18 19166 24509 34204 48077 61093 4452 88983 0700 13587177866 230000 285000 Revenues (Smill 5.8% 6,8% | 5.8% | 4.0% | 48% | 5.4% | 5.5% | &0% | 9.0% | 8.8% | 8.5% | 8.5% | Operating Margin 287.0 378.0 5680 1083.0 2159.0 3253.0 47460 62810 8116.0 11478 12000 12500 Depreciation (Smill 600.01 902.01 11 5201 6310 | 130.0 | 2740 d241.0 | 596,0 2371.0 | 2244.0| 4790|?5 Net ProfitSTil Total Deot $24640.0mil. Due in 5 Yrs $8229.0 LT Debt $24640.0 mill LTInterestS848.0 mil. | 26,1% | 21.8% | 23.5% | 31.2% | NUF | 31.8% ? .. 1 ??| 30.8% | 25.5% | 22,0% | 22,0% |Income Tax Rate 147% of Capi)| 3.7% | 3.4% | 1.3%| 2% | 4%. NMF .6% | 1.7%| 1.3%| 2.1%| 2.6% Net Profit Mar 3.1%. 1411.0 2433.0 33750 25940 2294.0 16450 32380 25750 1965.0 2314.0 860 1775 Working Cap(Smll 62535 687.0 109.0 4600 8530 3084.0 31910 82650 82350 76940 244 25000 28000 Long-Tem Debt (Smill29000 2672.0 18.9% | 17.1% | 16.0% | 7.7% | 1.6% | 2.7% | NMF | 3?| 9.7% | 5.1% | 8.0% | 11.0% Return on TotalCap'l 225% | 17.2% | 16.8% | 8.1% | 1.6% | 2.8% l NMF | 45% | 12.3% | 8.1%, | 14.0% | 17.5% Return on Shr 225% | 172% | 16.8% | 8.1% | 1.6%| 2.8% | NMF | 45% | 12.3% | 0.1% | 14.0% | 17.5% Retained to Com Eq Leases, Uncapitalized: $2427.0 mill. 5257.0 | 68640 | 7757? 81 920 | g7460 10741 | 13384 19285 | 2?709 | 33700| 42375 | Shr. Equity(Smil No Defined Benefit Pension Plan 16.0% 21.0% 21.0% Common Stock 485 226,904 shs. As of 418/18 MARKET CAP: $768 billion (Large Cap) CURRENT POSITION 2016 2017 3/3118 | NY NY All Div'ds 10 Net Prof BUSINESS: Amazon.com is one of the largest online relaiers. The Audible.com, 08, Zappos, '09, Whole Focds Market 17. Has about company opened tsvrual doors n 199 Seles breakdown 2017 : 230800 employees orticen directors own 163% of outstanding Nor Ame ca; 6 % cf sales. Inte to a sales. 31% of t tal common stock including Mr. Bezo 16.3% 418 p Pres Amazon Web Services (AWS, 9%. Third-party sellers dent. Chaiman & Chief Exeatve Offcer: Jeffrey Bezos. In- (Marketplace) account Ior about 20% of sales. Seasonality: Q4 ac, corporated: Deeware. Addr: 410 Temy Avenue North, Seattle, WA counted or 34% of 17 revenue. Acqured CDNow 02, 25981 11461 30986 16047 24963 13 40 vento y Av st 339 13164 1202 45781 60197 50829 25309 34616 25172 Debt Due 206-266-1000. Internet: waw.amazon.com. ur February review, sha ncomc taxes 43316 57883 48045 Amazon.com are trading markedly The company's positive momentum AMZNs quotation has risen roughly 10% and beyond. As a result, we have intro- posted better-than-expected first-quarter timates at $285 billion and S15.00 per To that end, the larges online AMZNs results will come from the raising year-over-year basis, to $51.042 bil- S119. At the same tine. the AWS cloud digit gains in volumes for bolh products mover advantage. And the company as a ANNUAL RATES Past Past Est'd'15-17 higher. In fact, over hat tme frame w ef change (per sh) 10YrYrs. 10 21-3A likely persist into next year duced our 2019 top- and bottom-line es share, respectively. Onc primary driver of Full re tailer's revenues rose 42.9% on a of its Prim e mi e m bership rate from $99 to 27.0% 22.5% 22.0% 39.5% 20.0% 27.5% Cal- QUARTERLY REVENUES $mill rom 128 30404 32714 3741 35987 37955 13744 60453 Tr866 2018 51042 53000 57000 68958 INGS PERS Full oper Year op Mar.31 Jun.30 sition of Whole Fouds, and a more accou nting for a 9% reduction in taxes, recent purchase of Ring, a home security 2016 1.07 1.78 52 54490 40 52 2.5 455 AMZNs bottom line dr 0% 4.50 2.90 3.00 460 15.00 our Cal CUARTERLY DIVDENDS PAID Full wc $0 price correction t (A) Dlted eamings. Excludes gocdaill cludes merger aoquisition costs: 02, (11c) 03, sum due to rounding. Nexeanings report cue udes s?ock-based compensatio 05, (200: 06, cludes other norrecurring ilems: 04, 54; '05 revenues and egs. may n Price Growth Persistence abe and i To subscribe call 1-800 VALUELINE VALUE AMAZON.COM NDQ-AIZN 97.4 145.9 185.6 246.7 284.405.6 408.1 698.4 847 2 1213 1638 47.6 106.8 160.6 172.0 245.8 284.0 285.3 474.0 747.7 1170 Target Price Ra 2021 2022 2023 nge Rased 5250 LEGENDS as r pgh 2021-23 PROJECTIONS Price Gain Return 25% Insider Decisions Institutional Decisions 01 50 746 773716 25 dpCo 316419 308782 2901 2002 2003 2004 2005 2006 2007 2008 2009 2010 2011 2012 2013 2014 2015 2016 2017 2018 2019| VALUE UNE PUBLLC 21-23 0.14 13.05.1620.41 25.8735.6844.7855.207584105.65 134.40 162.11 191.63 227.192850936749 47425 586.40 Revenues per sh 21 0 105 1.105 742.07 2.88 383.77 504 768 9.70 14.60 219928353460 41.00 Cash Flow" per sh d.01 40 879 45 132.04 253 132959 d.525 490 455 9.70 15.00 Earnings persh NiNi Div'ds Ded'd per sh 2475 26.75 Cap sh 03.4902.57 .56591.02.88 6.24 11.84 15.221705 18.02 21.22 23,13 2842 4043 525 69.50 87.20 Book Value per sh 387.91 403.35 403.35 416.00 414.00 416.00 428.00 444.00 451.00 455.07 454.55 459.26 46438 471.00 47700 48400 485.00 486.00 Common Shs Outst'g 48700 1 P/E Ratio MFI NUF NUF | VaiudLhe Relative PE Ratio 220 Avg Ann'l Div'd Yield CAPITAL STRUCTURE as of 331/18 19166 24509 34204 48077 61093 4452 88983 0700 13587177866 230000 285000 Revenues (Smill 5.8% 6,8% | 5.8% | 4.0% | 48% | 5.4% | 5.5% | &0% | 9.0% | 8.8% | 8.5% | 8.5% | Operating Margin 287.0 378.0 5680 1083.0 2159.0 3253.0 47460 62810 8116.0 11478 12000 12500 Depreciation (Smill 600.01 902.01 11 5201 6310 | 130.0 | 2740 d241.0 | 596,0 2371.0 | 2244.0| 4790|?5 Net ProfitSTil Total Deot $24640.0mil. Due in 5 Yrs $8229.0 LT Debt $24640.0 mill LTInterestS848.0 mil. | 26,1% | 21.8% | 23.5% | 31.2% | NUF | 31.8% ? .. 1 ??| 30.8% | 25.5% | 22,0% | 22,0% |Income Tax Rate 147% of Capi)| 3.7% | 3.4% | 1.3%| 2% | 4%. NMF .6% | 1.7%| 1.3%| 2.1%| 2.6% Net Profit Mar 3.1%. 1411.0 2433.0 33750 25940 2294.0 16450 32380 25750 1965.0 2314.0 860 1775 Working Cap(Smll 62535 687.0 109.0 4600 8530 3084.0 31910 82650 82350 76940 244 25000 28000 Long-Tem Debt (Smill29000 2672.0 18.9% | 17.1% | 16.0% | 7.7% | 1.6% | 2.7% | NMF | 3?| 9.7% | 5.1% | 8.0% | 11.0% Return on TotalCap'l 225% | 17.2% | 16.8% | 8.1% | 1.6% | 2.8% l NMF | 45% | 12.3% | 8.1%, | 14.0% | 17.5% Return on Shr 225% | 172% | 16.8% | 8.1% | 1.6%| 2.8% | NMF | 45% | 12.3% | 0.1% | 14.0% | 17.5% Retained to Com Eq Leases, Uncapitalized: $2427.0 mill. 5257.0 | 68640 | 7757? 81 920 | g7460 10741 | 13384 19285 | 2?709 | 33700| 42375 | Shr. Equity(Smil No Defined Benefit Pension Plan 16.0% 21.0% 21.0% Common Stock 485 226,904 shs. As of 418/18 MARKET CAP: $768 billion (Large Cap) CURRENT POSITION 2016 2017 3/3118 | NY NY All Div'ds 10 Net Prof BUSINESS: Amazon.com is one of the largest online relaiers. The Audible.com, 08, Zappos, '09, Whole Focds Market 17. Has about company opened tsvrual doors n 199 Seles breakdown 2017 : 230800 employees orticen directors own 163% of outstanding Nor Ame ca; 6 % cf sales. Inte to a sales. 31% of t tal common stock including Mr. Bezo 16.3% 418 p Pres Amazon Web Services (AWS, 9%. Third-party sellers dent. Chaiman & Chief Exeatve Offcer: Jeffrey Bezos. In- (Marketplace) account Ior about 20% of sales. Seasonality: Q4 ac, corporated: Deeware. Addr: 410 Temy Avenue North, Seattle, WA counted or 34% of 17 revenue. Acqured CDNow 02, 25981 11461 30986 16047 24963 13 40 vento y Av st 339 13164 1202 45781 60197 50829 25309 34616 25172 Debt Due 206-266-1000. Internet: waw.amazon.com. ur February review, sha ncomc taxes 43316 57883 48045 Amazon.com are trading markedly The company's positive momentum AMZNs quotation has risen roughly 10% and beyond. As a result, we have intro- posted better-than-expected first-quarter timates at $285 billion and S15.00 per To that end, the larges online AMZNs results will come from the raising year-over-year basis, to $51.042 bil- S119. At the same tine. the AWS cloud digit gains in volumes for bolh products mover advantage. And the company as a ANNUAL RATES Past Past Est'd'15-17 higher. In fact, over hat tme frame w ef change (per sh) 10YrYrs. 10 21-3A likely persist into next year duced our 2019 top- and bottom-line es share, respectively. Onc primary driver of Full re tailer's revenues rose 42.9% on a of its Prim e mi e m bership rate from $99 to 27.0% 22.5% 22.0% 39.5% 20.0% 27.5% Cal- QUARTERLY REVENUES $mill rom 128 30404 32714 3741 35987 37955 13744 60453 Tr866 2018 51042 53000 57000 68958 INGS PERS Full oper Year op Mar.31 Jun.30 sition of Whole Fouds, and a more accou nting for a 9% reduction in taxes, recent purchase of Ring, a home security 2016 1.07 1.78 52 54490 40 52 2.5 455 AMZNs bottom line dr 0% 4.50 2.90 3.00 460 15.00 our Cal CUARTERLY DIVDENDS PAID Full wc $0 price correction t (A) Dlted eamings. Excludes gocdaill cludes merger aoquisition costs: 02, (11c) 03, sum due to rounding. Nexeanings report cue udes s?ock-based compensatio 05, (200: 06, cludes other norrecurring ilems: 04, 54; '05 revenues and egs. may n Price Growth Persistence abe and i To subscribe call 1-800 VALUELINEStep by Step Solution
There are 3 Steps involved in it
Step: 1

Get Instant Access to Expert-Tailored Solutions
See step-by-step solutions with expert insights and AI powered tools for academic success
Step: 2

Step: 3
Ace Your Homework with AI
Get the answers you need in no time with our AI-driven, step-by-step assistance
Get Started
Enterprise Applications And Services In The Finance Industry
Authors: Artur Lugmayr
1st Edition
331928150X,3319281518