

Answered step by step
Verified Expert Solution
Question
1 Approved Answer
Determine the value of x shown in the diagram. (Figure may not be drawn to scale.) x=19 x=20 x= 405 O** x=450 12 12
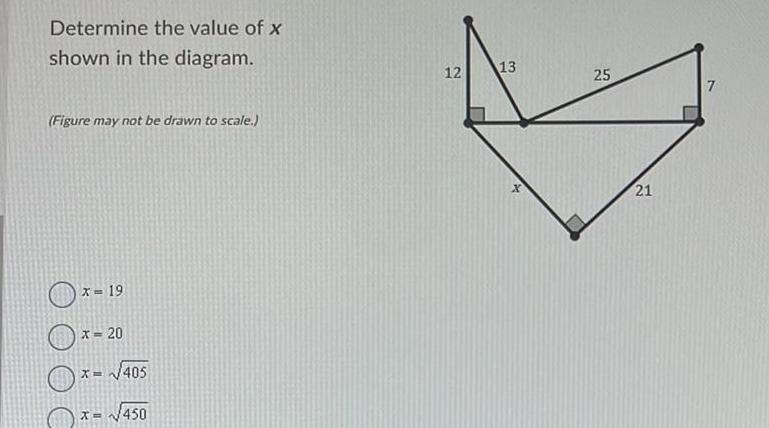
Determine the value of x shown in the diagram. (Figure may not be drawn to scale.) x=19 x=20 x= 405 O** x=450 12 12 13 25 7 21 22
Step by Step Solution
There are 3 Steps involved in it
Step: 1

Get Instant Access to Expert-Tailored Solutions
See step-by-step solutions with expert insights and AI powered tools for academic success
Step: 2

Step: 3
Ace Your Homework with AI
Get the answers you need in no time with our AI-driven, step-by-step assistance
Get Started
Statistical Methods For The Social Sciences
Authors: Alan Agresti
5th Edition
013450710X, 978-0134507101