

Question: Develop a complete CTQ diagram making sure to establish the customer's need up to the CTQ specifications. Be sure to integrate actual metrics and explain
Develop a complete CTQ diagram making sure to establish the customer's need up to the CTQ specifications. Be sure to integrate actual metrics and explain the assumptions made to complete the diagram. (35% of proof)
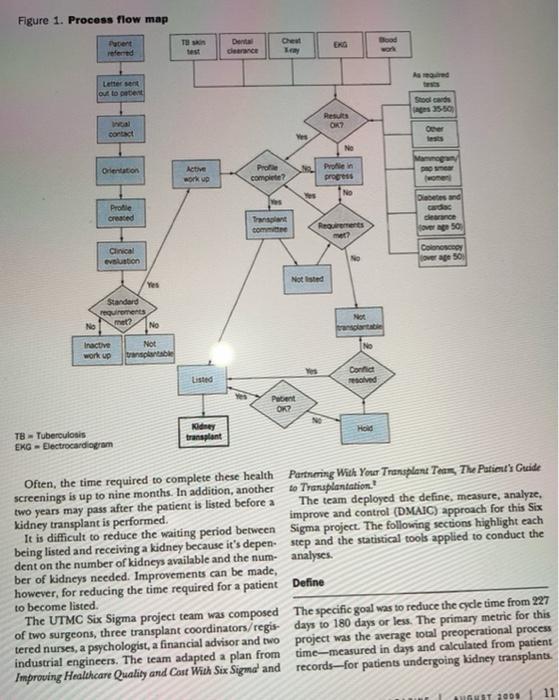
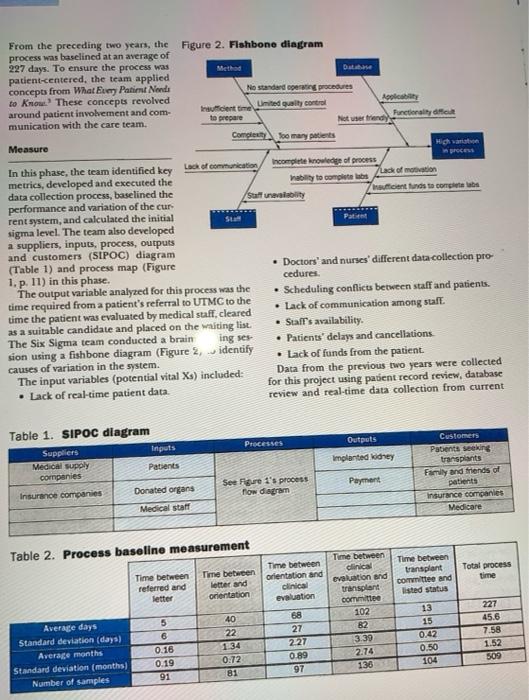
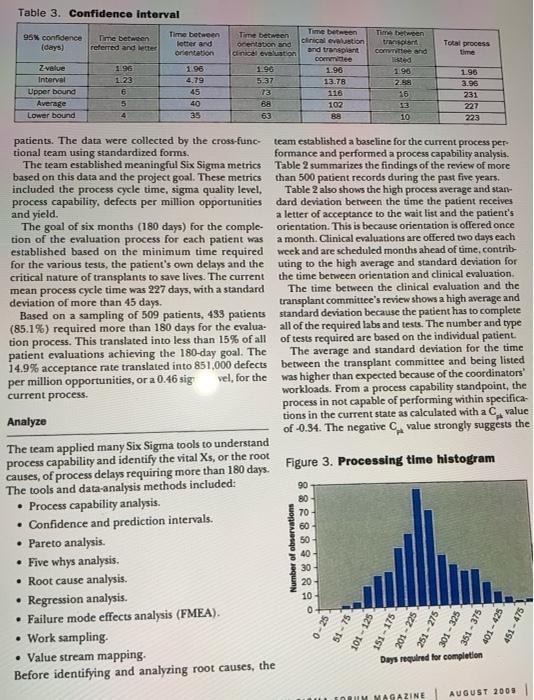
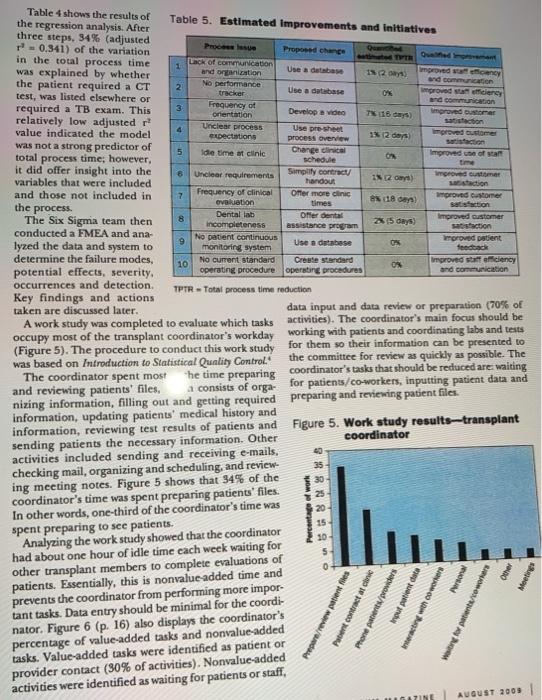
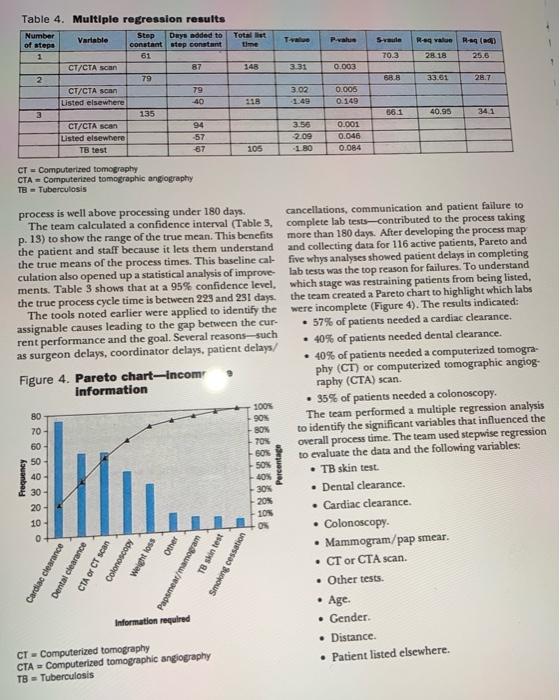
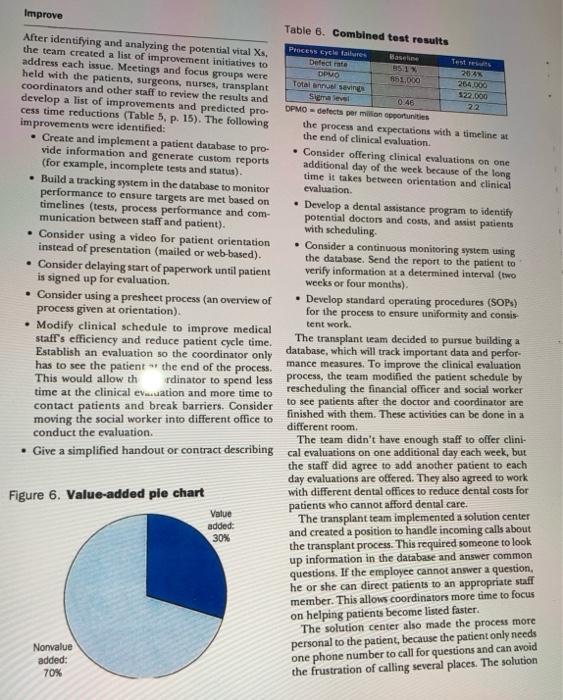
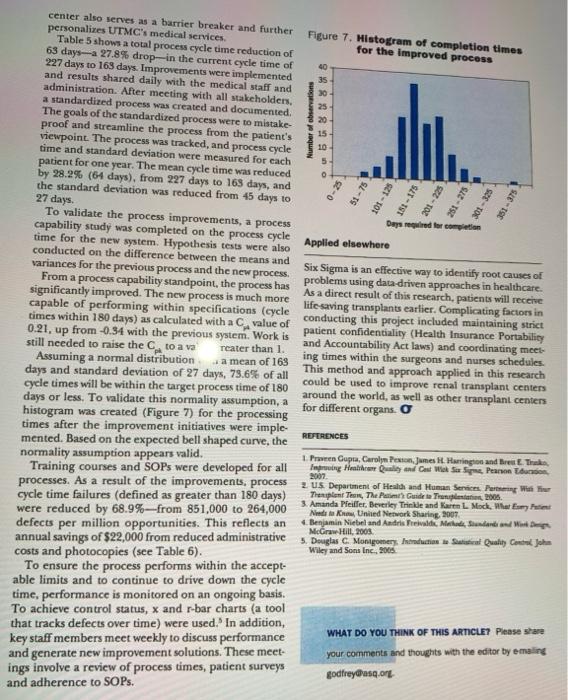
Perfect Match TEAM APPLIES SIX SIGMA TO REDUCE TIME IT TAKES TO QUALIFY PATIENTS FOR KIDNEY TRANSPLANTS . . By Matthew Franchetti and Kyle Bedal, University of Toledo n January 2008, the University of Toledo Medical Center (UTMC) in northwest Ohio collaborated with the University of Toledo's Industrial Engineering Department to analyze and improve the preoperational pro centes for patients undergoing kidney transplants. Six Sigma was applied to the project, and the following goals were established: Optimize cycle times Enhance customer satisfaction. Improve efficiencies. Reduce costs Streamline administrative processes Eliminate errors. Improve protocol execution and effectiveness. Themiect's primary metric was the number of days required from the date a Ent was referred to UTMC for a kidney transplant to the date the hospital staff declared the patient a suitable transplant candidate. The research was needed and the project selected because of an increase in the number of patients awaiting transplants and the number of transplants performed per year because of the increased service area for UTMC. Because of a waiting list of nearly 500 patients, it was determined a reduced cycle time would save lives. Background and terminology For more than 30 years, UTMC has performed adult and pediatric kidney transplants as one of the treatment options for end-stage renal disease. Since UTMC's first kidney transplant operation in 1972, more than 1,500 kidney transplant operations have been performed there, with an average patient survival rate of 98% and a graft survival rate of 94%. The program relies on advanced surgical techniques including laparoscopic kidney donation, improved anti-rejection medications and high-quality patient care-to make it one of the most successful programs in the country There are a number of steps patients must complete before receiving a kidney transplant. Generally, the patient must be referred to a medical center and complete required labs and tests to determine if he or she is suitable. The labs and tests are usually similar among all transplant centers and among patients. The labs include tuberculosis (TB) sests, dental clearance, a colonoscopy. chest X-rays, electrocardiography tests, stool samples, blood work, mammograms, pap smears and diabetes tests. Once the patient fulfills the requirements, a committee reviews the results and determines whether the patient is a good candidate. The patient is then allowed to receive a kidney, this is called being "listed," or placed on the waiting list. Figure 1. Process flow map Putert referred Bed Den detrance Chev Ley test Lettersen out to deter So card 35-50 Results OR? ino contact Over Mano Orientation Active work up Pro complete? progo es Diabetes and Profile created derance Transplant come Rrements Colonosco Clinical evolution No rape 50 Not Isted Yes Standard requirements No No met? tra No Inactive work up Not tarptable Contat resolved Listed Patient OK? Ne Kidney transplant Hold TB - Tuberculosis EKG Electrocardiogram Often, the time required to complete these health Partnering With Your Transplant Tens The Patient's Guide screenings is up to nine months. In addition, another to Transplantation. two years may pass after the patient is listed before a The team deployed the define, measure, analyze, kidney transplant is performed improve and control (DMAIC) approach for this Six It is difficult to reduce the waiting period between Sigma project. The following sections highlight each being listed and receiving a kidney because it's depenstep and the statistical tools applied to conduct the dent on the number of kidneys available and the num- analyses. ber of kidneys needed. Improvements can be made, however, for reducing the time required for a patient Define to become listed The UTMC Six Sigma project team was composed The specific goal was to reduce the cycle time from 227 of two surgeons, three transplant coordinators/regis days to 180 days or less. The primary metric for this tered nurses, a psychologist, a financial advisor and two project was the average total preoperational process industrial engineers. The team adapted a plan from time-measured in days and calculated from patient Improving Healthcare Quality and Cost With Six Sigma and records-for patients undergoing kidney transplants. 11 GUST 2008 Patient From the preceding two years, the Figure 2. Fishbone diagram process was baselined at an average of 227 days. To ensure the process was Method Database patient-centered, the team applied concepts from What Eumy Patient Nonde No standard opening procedures to know. These concepts revolved Soy Umited quality control Insufficient time around patient involvement and com munication with the care team, to prepare Not a friend Functionality of Completo many patients Measure Haarata Incomplete knowledge of process In this phase, the team identified key lack of communication Lack of motivation metrics, developed and executed the hability to completes data collection process, baselined the Su unavy Insuficient and to com performance and variation of the cur rent system, and calculated the initial sta sigma level. The team also developed a suppliers, inputs, process, outputs and customers (SIPOC) diagram (Table 1) and process map (Figure Doctors' and nurses' different data collection pro 1. p. 11) in this phase. cedures The output variable analyzed for this process was the Scheduling conflicts between staff and patients. time required from a patient's referral to UTMC to the Lack of communication among saft. time the patient was evaluated by medical staff, cleared as a suitable candidate and placed on the waiting list. Staff's availability. The Six Sigma team conducted a brain ing ses Patients' delays and cancellations sion using a fishbone diagram (Figure 2, identify . Lack of funds from the patient. causes of variation in the system. The input variables (potential vital Xs) included: Data from the previous two years were collected for this project using patient record review, database . Lack of real-time patient data review and real-time data collection from current Table 1. SIPOC diagram Processes Outputs Inputs Patients Suppliers Medical supply cornpanies Implanted kidney Customers Patients seeking transplants Family and friends of patients Insurance companies Medicare Payment Donated organs See Figure 1's process flow diagram Insurance companies Medical staff Table 2. Process baseline measurement Total process time Time between referred and letter Time between Letter and orientation Time between transplant Committee and listed status Time between orientation and clinical evaluation Time between clinical evaluation and transplant committee 102 B2 3.39 2.74 135 Average days Standard deviation (days) Average months Standard deviation (months) Number of samples 5 6 0.16 0.19 91 68 27 227 0.89 97 40 22 1:34 0:72 81 13 15 0.42 0.50 104 227 45.6 7.58 1.52 509 Table 3. Confidence interval 95% confidence (days) Time between referred and better Time between tran Come and Total process time Z value Interval Upper bound Average Lower bound 1.96 1.23 6 5 4 Time between letter and orientation 1.96 4.79 45 40 35 Time better Time between ocentation and clinical evaluation and transplant Clinical evaluation Committee 1.96 1.96 5.37 13.78 13 116 88 102 89 1.98 2.BS 16 13 10 1.96 3.96 231 227 223 patients. The data were collected by the cross-func team established a baseline for the current process per tional team using standardized forms. formance and performed a process capability analysis. The team established meaningful Six Sigma metrics Table 2 summarizes the findings of the review of more based on this data and the project goal. These metrics than 500 patient records during the past five years. included the process cycle time, sigma quality level, Table 2 also shows the high process average and stan- process capability, defects per million opportunities dard deviation between the time the patient receives and yield. a letter of acceptance to the wait list and the patient's The goal of six months (180 days) for the comple- orientation. This is because orientation is offered once tion of the evaluation process for each patient was a month. Clinical evaluations are offered two days each established based on the minimum time required week and are scheduled months ahead of time, contrib- for the various tests, the patient's own delays and the uting to the high average and standard deviation for critical nature of transplants to save lives. The current the time between orientation and clinical evaluation mcan process cycle time was 227 days, with a standard The time between the clinical evaluation and the deviation of more than 45 days. transplant committee's review shows a high average and Based on a sampling of 509 patients, 493 patients standard deviation because the patient has to complete (85.1%) required more than 180 days for the evalua- all of the required labs and tests. The number and type tion process. This translated into less than 15% of all of tests required are based on the individual patient. patient evaluations achieving the 180-day goal. The The average and standard deviation for the time 14.9% acceptance rate translated into 851,000 defects between the transplant committee and being listed per million opportunities, or a 0.46 sig vel, for the was higher than expected because of the coordinators current process. workloads. From a process capability standpoint, the process in not capable of performing within specifica Analyze tions in the current state as calculated with a value of -0.34. The negative value strongly suggests the The team applied many Six Sigma tools to understand process capability and identify the vital Xs, or the root causes, of process delays requiring more than 180 days. Figure 3. Processing time histogram The tools and data-analysis methods included: 90 Process capability analysis. 80 70 Confidence and prediction intervals. 60 Pareto analysis. 50 Five why analysis. 40 30 Root cause analysis. 20 Regression analysis. 10 Failure mode effects analysis (FMEA). Work sampling Value stream mapping. Days required for completion Before identifying and analyzing root causes, the Number of observations .6888888 0-25 51-75 251 - 275 101 - 125 201 - 225 301 - 325 151 - 175 401 - 425 451 - 475 INRUM MAGAZINE AUGUST 2009 1 2. 0% satisfaction Improved action Improved customer times 8 sfaction Table 4 shows the results of the regression analysis. After Table 5. Estimated Improvements and initiatives three steps, 34% (adjusted 0.341) of the variation Procesu Proposed chance in the total process time TV Go Lack of CONTWication was explained by whether and organization Use a database improved when the patient required a CT No performance and communication tracker test, was listed elsewhere or Use a database improved an eficiency and communication required a TB exam. This 3 Frequency of Orientation Develop a video improved relatively low adjusted r? Unclear process value indicated the model 4 Use pre-sheet expectations 11 12 process Overview Improved customer was not a strong predictor of 5 Idle time at clinic Change clinical total process time, however, Improved of an schedule ON it did offer insight into the 6 Uncler requirements Simply contract variables that were included IN 2) handout and those not included in 7 Frequency of clinical Omer more clinic Ovation e 18 the process satisfaction Dental lab The Six Sigma team then Ofter dental Improved customer incompleteness 25 days) assistance program conducted a FMEA and ana- 9 No patient continuous lyzed the data and system to Use a database Improved patient monitoring system determine the failure modes, 10 No current standard Create standard Improved staticiency 09 potential effects, severity. operating procedure operating procedures and communication occurrences and detection, TPTR - Total process time reduction Key findings and actions taken are discussed later. data input and data review or preparation (70% of A work study was completed to evaluate which tasks activities). The coordinator's main focus should be occupy most of the transplant coordinator's workday working with patients and coordinating labs and tests (Figure 5). The procedure to conduct this work study for them so their information can be presented to was based on Introduction to Statistical Quality Control the committee for review as quickly as possible. The The coordinator spent most "he time preparing coordinator's tasks that should be reduced are waiting and reviewing patients' files, a consists of orga- for patients/co-workers, inputting patient data and nizing information, filling out and getting required preparing and reviewing patient files. information, updating patients' medical history and information, reviewing test results of patients and Figure 5. Work study results-transplant coordinator sending patients the necessary information. Other 40 activities included sending and receiving e-mails, 35 checking mail, organizing and scheduling, and review ing meeting notes. Figure 5 shows that 34% of the 30 coordinator's time was spent preparing patients' files. 20 In other words, one-third of the coordinator's time was 15 spent preparing to see patients. Analyzing the work study showed that the coordinator had about one hour of idle time each week waiting for other transplant members to complete evaluations of patients. Essentially, this is nonvalue-added time and prevents the coordinator from performing more impor- tant tasks. Data entry should be minimal for the coordi- nator. Figure 6 (p. 16) also displays the coordinator's percentage of value-added tasks and nonvalue-added tasks. Value-added tasks were identified as patient or provider contact (50% of activities). Nonvalue-added activities were identified as waiting for patients or staff, 25 Percent of work B % 10 5 0 1 wonal Other Meetings Prepare/review patients Patient contract at clinic Phone et/providers Input patient data Interacting with owners ting for patient/workers AUGUST 2009 Totalt P.value Saule R-e valun Ragadi) 28 18 25.5 70.3 3.31 0.003 68.8 33.51 28.7 Table 4. Multiple regression results Number Step Dwys noded to Variable of stepe constant step constant 1 61 CT/CTA scan 87 2 79 CT/CTA scan 79 Listed elsewhere 40 3 135 / n 94 Listed elsewhere -57 TB test 3.02 0.005 118 0.149 561 40.95 341 356 209 -1 80 0.001 0.046 0.084 105 CT Computerized tomography CTA = Computerized tomographic angiography TB Tuberculosis 90 process is well above processing under 180 days. cancellations, communication and patient failure to The team calculated a confidence interval (Table 3, complete lab tests-contributed to the process taking p. 13) to show the range of the true mean. This benefits more than 180 days. After developing the process map the patient and staff because it lets them understand and collecting data for 116 active patients, Pareto and the true means of the process times. This baseline cal- five whys analyses showed patient delays in completing culation also opened up a statistical analysis of improve lab tests was the top reason for failures. To understand ments. Table 3 shows that at a 95% confidence level, which stage was restraining patients from being listed, the true process cycle time is between 223 and 231 days. the team created a Pareto chart to highlight which labs The tools noted earlier were applied to identify the were incomplete (Figure 4). The results indicated: assignable causes leading to the gap between the cur- 57% of patients needed a cardiac clearance. rent performance and the goal. Several reasons-such as surgeon delays, coordinator delays, patient delays/ 40% of patients needed dental clearance. 40% of patients needed a computerized tomogra- Figure 4. Pareto chart-incom phy (CT) or computerized tomographic angiog- information raphy (CTA) scan 35% of patients needed a colonoscopy. 80 300 The team performed a multiple regression analysis 70 -BOX to identify the significant variables that influenced the 60 70 overall process time. The team used stepwise regression 50 SON to evaluate the data and the following variables: 40 50% TB skin test. 40 30 30% Dental clearance. 20 -20% Cardiac clearance 105 10 ON 0 Colonoscopy Mammogram/pap smear CT or CTA scan. Other tests. Age Information required Gender. CT - Computerized tomography Distance CTA Computerized tomographic angiography Patient listed elsewhere. TB Tuberculosis Frequency Percentage 1 Other Cardiac clearance Dental clearance Colonoscopy CIA Or CT scan Weight loss skin test Papsmet/mamogram Smoking cessation Test Improve Table 6. Combined test results After identifying and analyzing the potential vital Xs. Process Cycle Galles the team created a list of improvement initiatives to Defecte address each issue. Meetings and focus groups were 351 204 DRVO held with the patients, surgeons, nurses, transplant 51.000 Total seine 264.000 coordinators and other staff to review the results and 522.000 Sigmaleval 0.46 develop a list of improvements and predicted pro 22 OPMO defects per million pounds cess time reductions (Table 5, p. 15). The following improvements were identified: the process and expectations with a timeline at the end of clinical evaluation. Create and implement a patient database to pro- vide information and generate custom reports Consider offering clinical evaluations on one (for example, incomplete tests and status). additional day of the week because of the long time it takes between orientation and clinical Build a tracking system in the database to monitor evaluation performance to ensure targets are met based on Develop a dental assistance program to identify timelines (tests, process performance and com- munication between staff and patient). potential doctors and costs, and artist patients with scheduling . Consider using a video for patient orientation . Consider a continuous monitoring system using instead of presentation (mailed or web-based). the database. Send the report to the patient to . Consider delaying start of paperwork until patient verify information at a determined interval (two is signed up for evaluation. weeks or four months). . Consider using a presheet process (an overview of Develop standard operating procedures (SOPs) process given at orientation) for the process to ensure uniformity and consis tent work . Modify clinical schedule to improve medical staff's efficiency and reduce patient cycle time. The transplant team decided to pursue building a database, which will track important data and perfor Establish an evaluation so the coordinator only mance measures. To improve the clinical evaluation has to see the patient the end of the process. This would allow th rdinator to spend less process, the team modified the patient schedule by time at the clinical ev.uation and more time to rescheduling the financial officer and social worker contact patients and break barriers. Consider to see patients after the doctor and coordinator are finished with them. These activities can be done in a moving the social worker into different office to different room conduct the evaluation The team didn't have enough staff to offer clini- Give a simplified handout or contract describing cal evaluations on one additional day each week, but the staff did agree to add another patient to each day evaluations are offered. They also agreed to work with different dental offices to reduce dental costs for Figure 6. Value-added pie chart patients who cannot afford dental care. Value The transplant team implemented a solution center and created a position to handle incoming calls about the transplant process. This required someone to look up information in the database and answer common questions. If the employee cannot answer a question, he or she can direct patients to an appropriate staff added: 30% member. This allows coordinators more time to focus on helping patients become listed faster. The solution center also made the process more personal to the patient, because the patient only needs one phone number to call for questions and can avoid the frustration of calling several places. The solution Nonvalue added: 70% Figure 7. Histogram of completion times for the improved process Number of observations 6 8 8 8 8 8 15 O ST-0 31-75 101 - 125 151 - 175 201-225 251 - 275 01 - 325 351 - 375 center also serves as a barrier breaker and further personalizes UTMC's medical services Table 5 shows a total process cycle time reduction of 63 daysa 27.8% drop in the current cycle time of 227 days to 163 days. Improvements were implemented 40 and results shared daily with the medical staff and 35 administration. After meeting with all stakeholders, 30 a standardized process was created and documented. 25 The goals of the standardized process were to mistake- proof and streamline the process from the patient's viewpoint. The process was tracked, and process cycle time and standard deviation were measured for cach 5 patient for one year. The mean cycle time was reduced by 28.2% (64 days), from 227 days to 163 days, and the standard deviation was reduced from 45 days to 27 days To validate the process improvements, a process Desired for comme capability study was completed on the process cycle time for the new system. Hypothesis tests were also Applied elsewhere conducted on the difference between the means and variances for the previous process and the new process. Six Sigma is an effective way to identify root causes of From a process capability standpoint, the process has problems using data-driven approaches in healthcare significantly improved. The new process is much more As a direct result of this research, patients will receive capable of performing within specifications (cycle lifesaving transplants cartier. Complicating factors in times within 180 days) as calculated with a value of conducting this project included maintaining strict 0.21, up from -0.34 with the previous system. Work is patient confidentiality (Health Insurance Portability still needed to raise the C to a va and Accountability Act laws) and coordinating meet- reater than 1. Assuming a normal distribution ing times within the surgeons and nurses schedules a mean of 163 days and standard deviation of 27 days, 73.6% of all This method and approach applied in this research could be used to improve renal transplant centers cycle times will be within the target process time of 180 around the world, as well as other transplant centers days or less. To validate this normality assumption, a for different organs. O histogram was created (Figure 7) for the processing times after the improvement initiatives were imple REFERENCES mented. Based on the expected bell shaped curve, the normality assumption appears valid. 1. Pre Gupta, Carolyn Post, Jumest. Harrington and Break Training courses and SOPs were developed for all Inging Health and Cost Wie Sie Pearon un 2007 processes. As a result of the improvements, process 2. US Department of Health and Human Services Parts Wwe cycle time failures (defined as greater than 180 days) The plant Thor, The Past Guide i Trol, 2005 3. Amanda Preiler. Beverley Trinkle and Karen L Mock, What were reduced by 68.9%--from 851,000 to 264,000 Niet United Network Sharing, 2007 4. Benjamin Niebel and Andris Freivalds, Mud Sudan defects per million opportunities. This reflects an McGraw Hill, 2003 annual savings of $22,000 from reduced administrative 5. Douglas G. Montgomery Induction to al Quality Controllo Wiley and Sons Inc., 2005 costs and photocopies (see Table 6). To ensure the process performs within the accept- able limits and to continue to drive down the cycle time, performance is monitored on an ongoing basis. To achieve control status, x and r-bar charts (a tool that tracks defects over time) were used. In addition, WHAT DO YOU THINK OF THIS ARTICLE? Please share key staff members meet weekly to discuss performance your comments and thoughts with the editor by emaling and generate new improvement solutions. These meet ings involve a review of process times, patient surveys godfreyCasq.org and adherence to SOPs
Step by Step Solution
There are 3 Steps involved in it

Get step-by-step solutions from verified subject matter experts