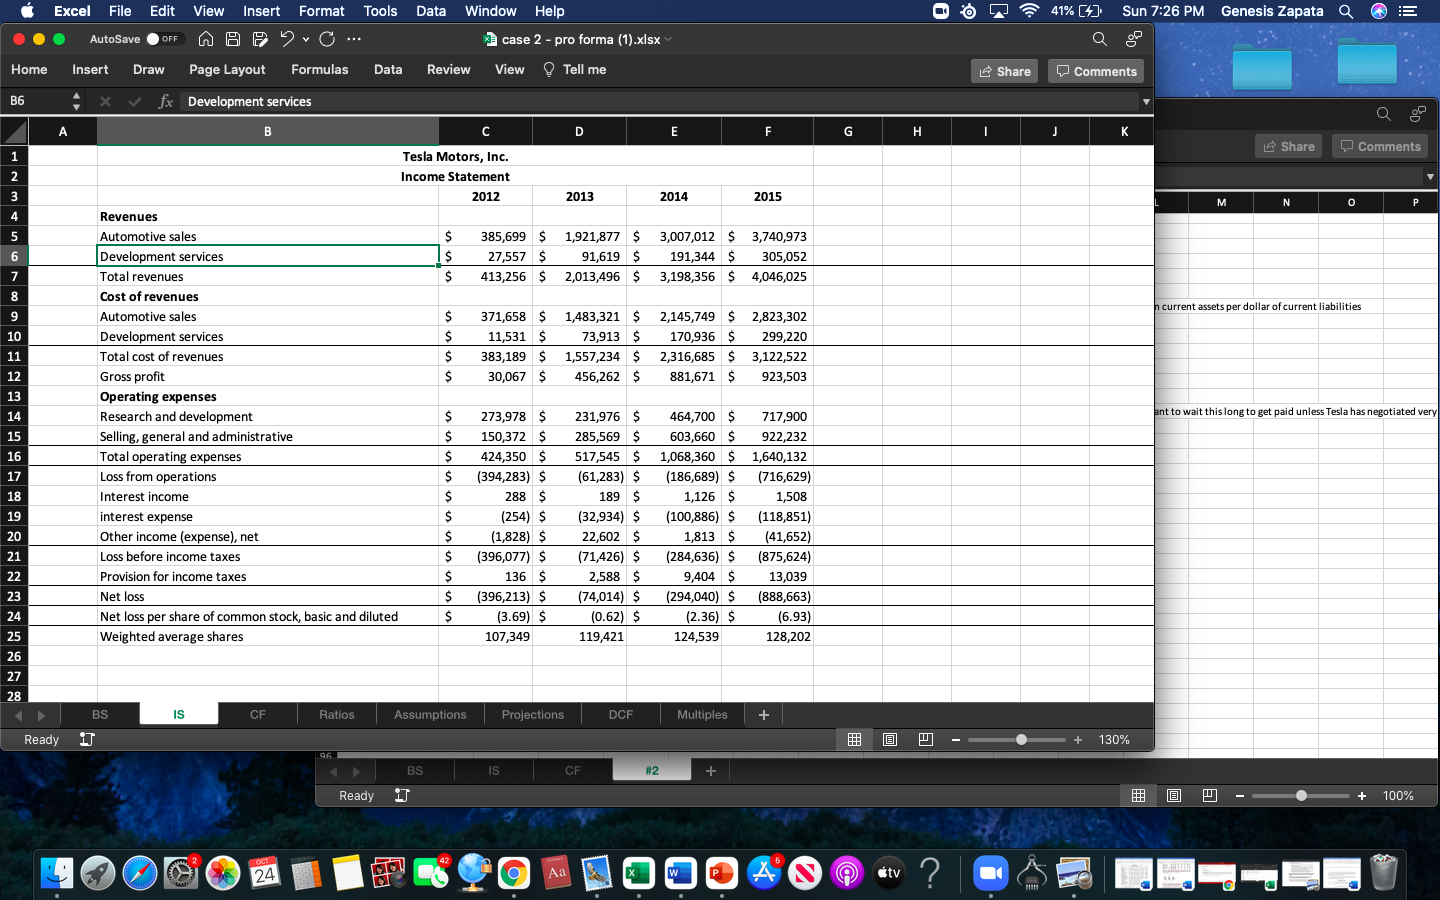
Develop a pro forma income statement and balance sheet for the years 2016, 2017, and 2018. Assumptions should be based on historical data continue and
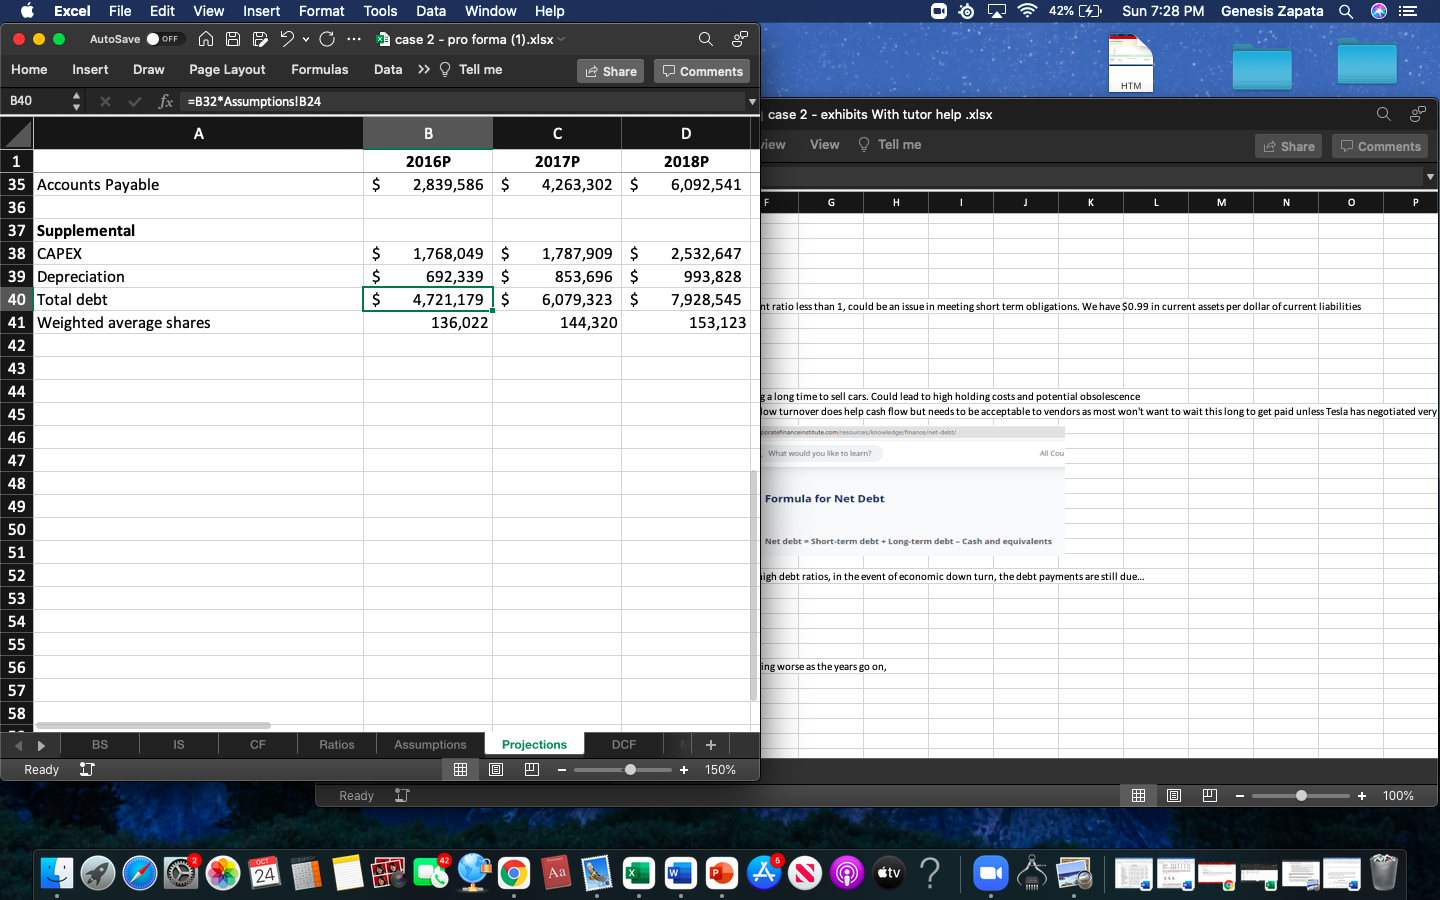
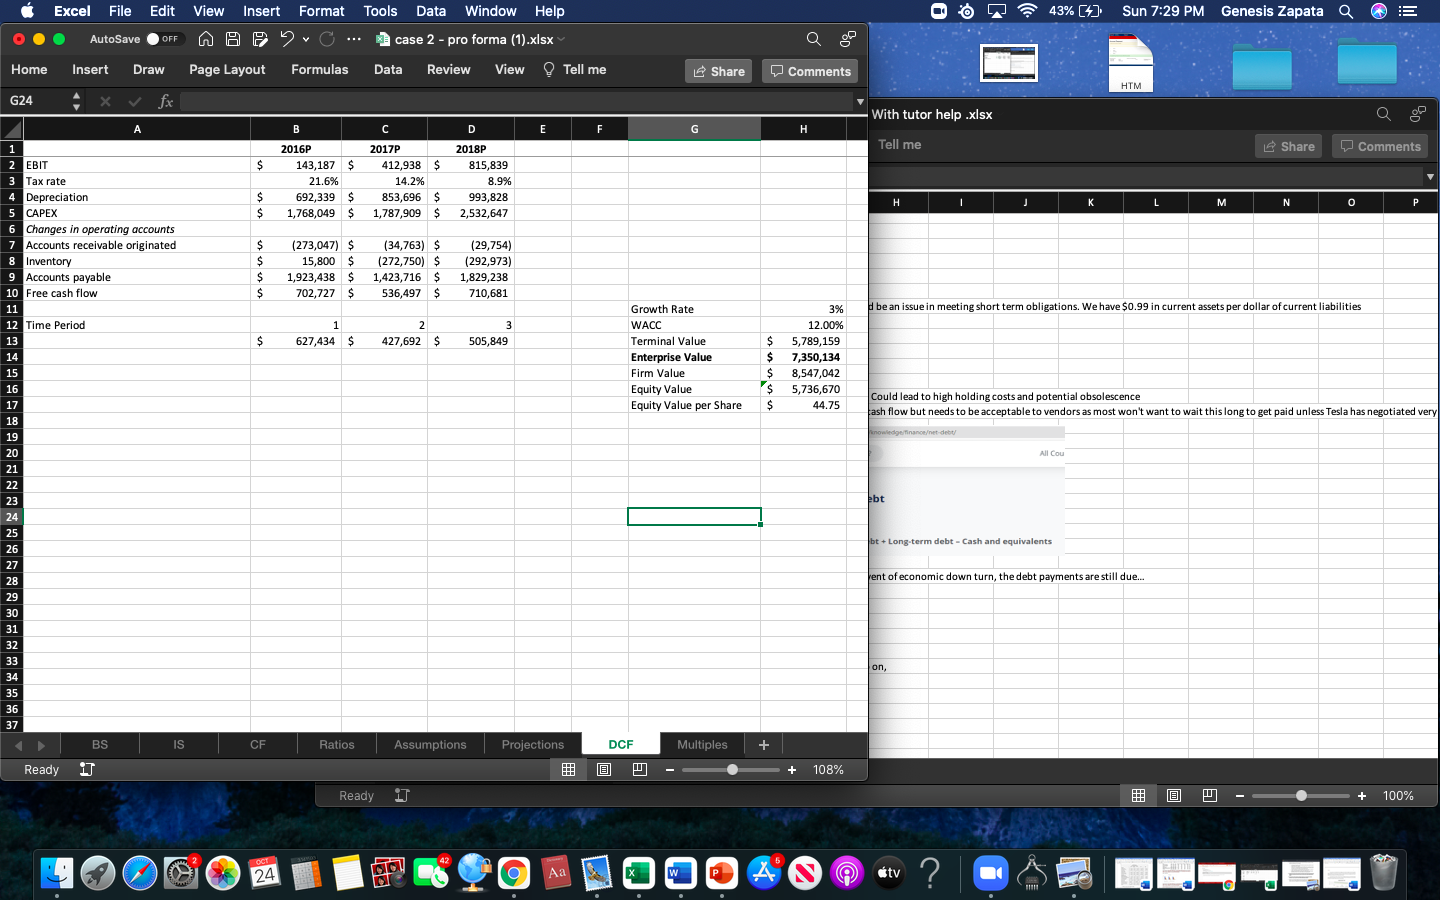
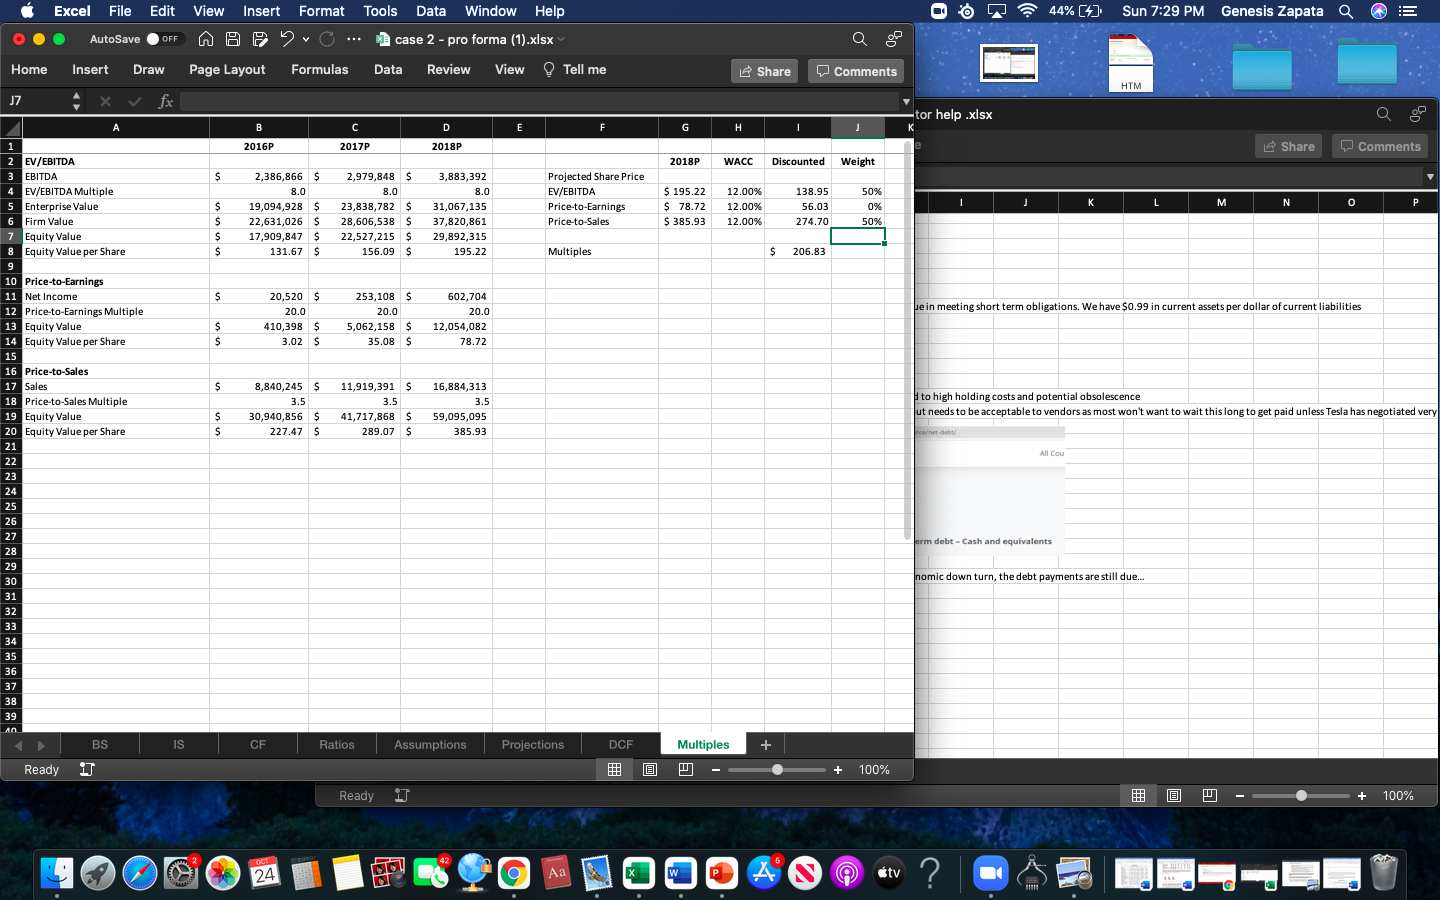
Using either a DCF valuation, multiple valuation, or a combination of both, determine a price target for Tesla.
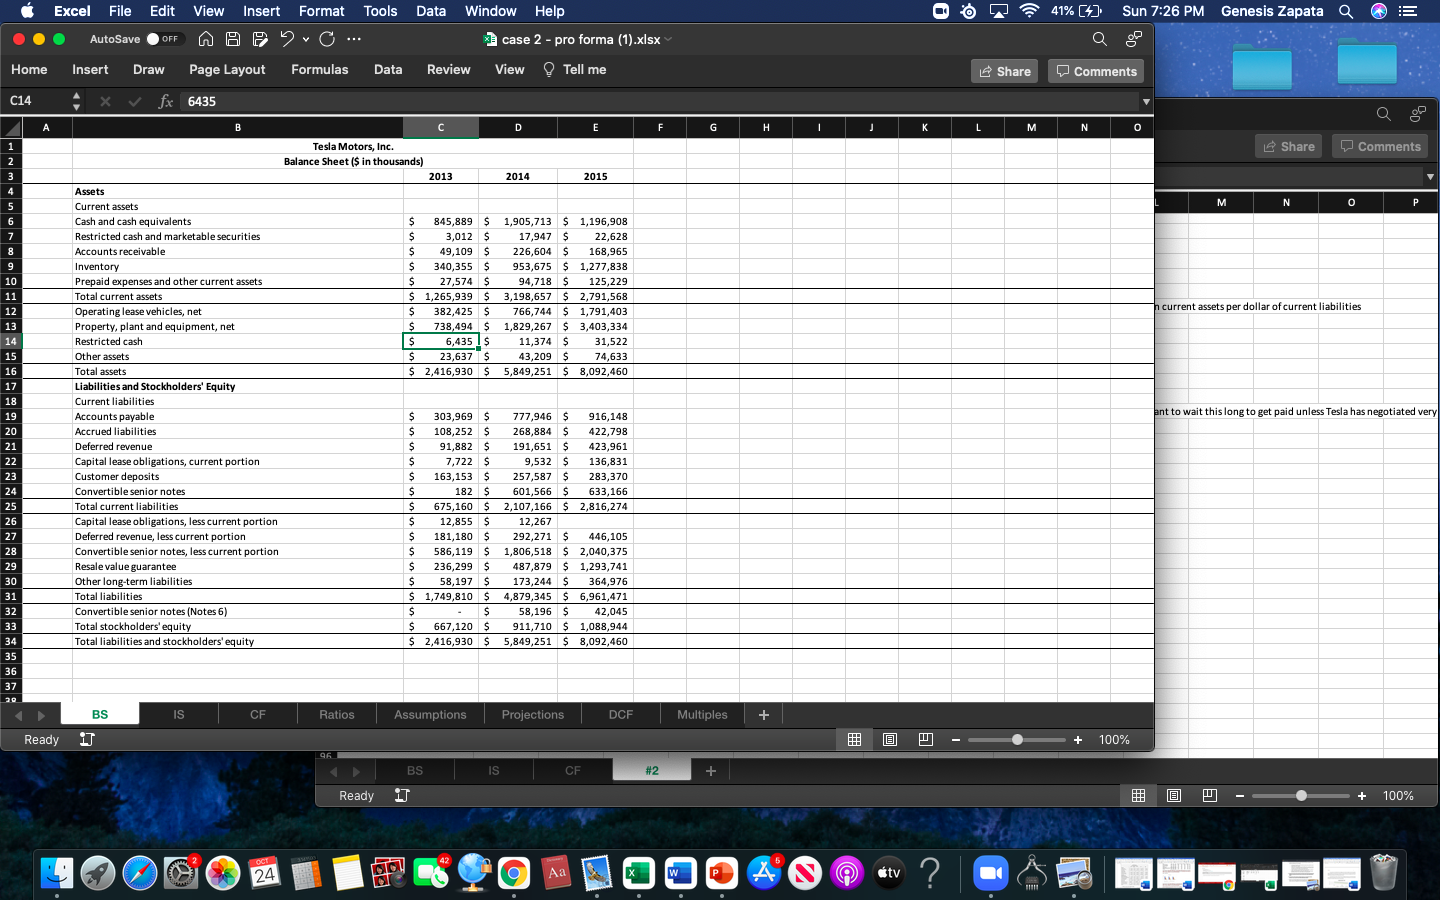
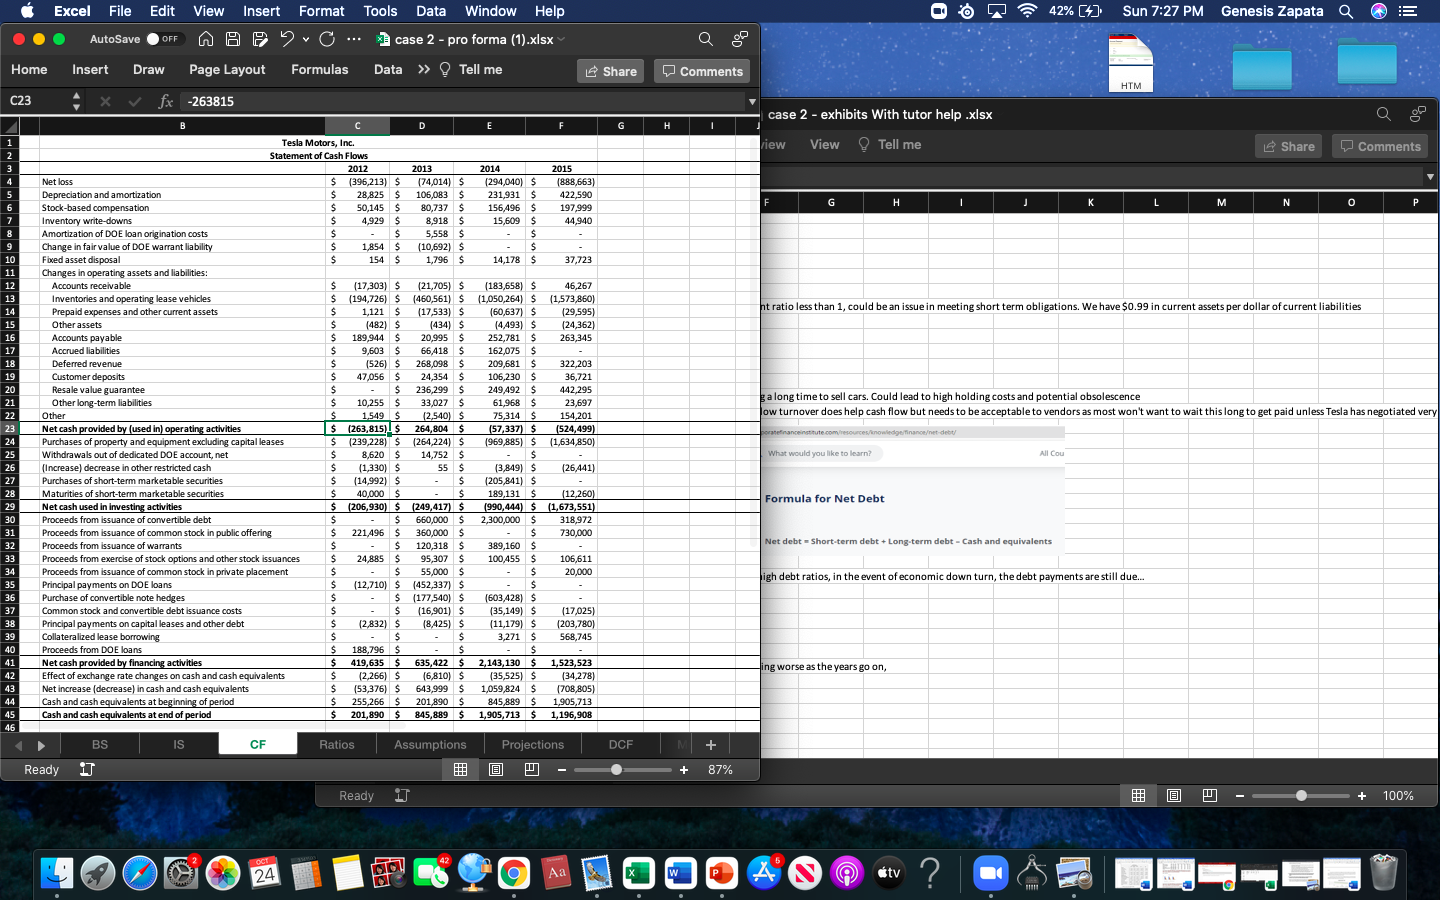
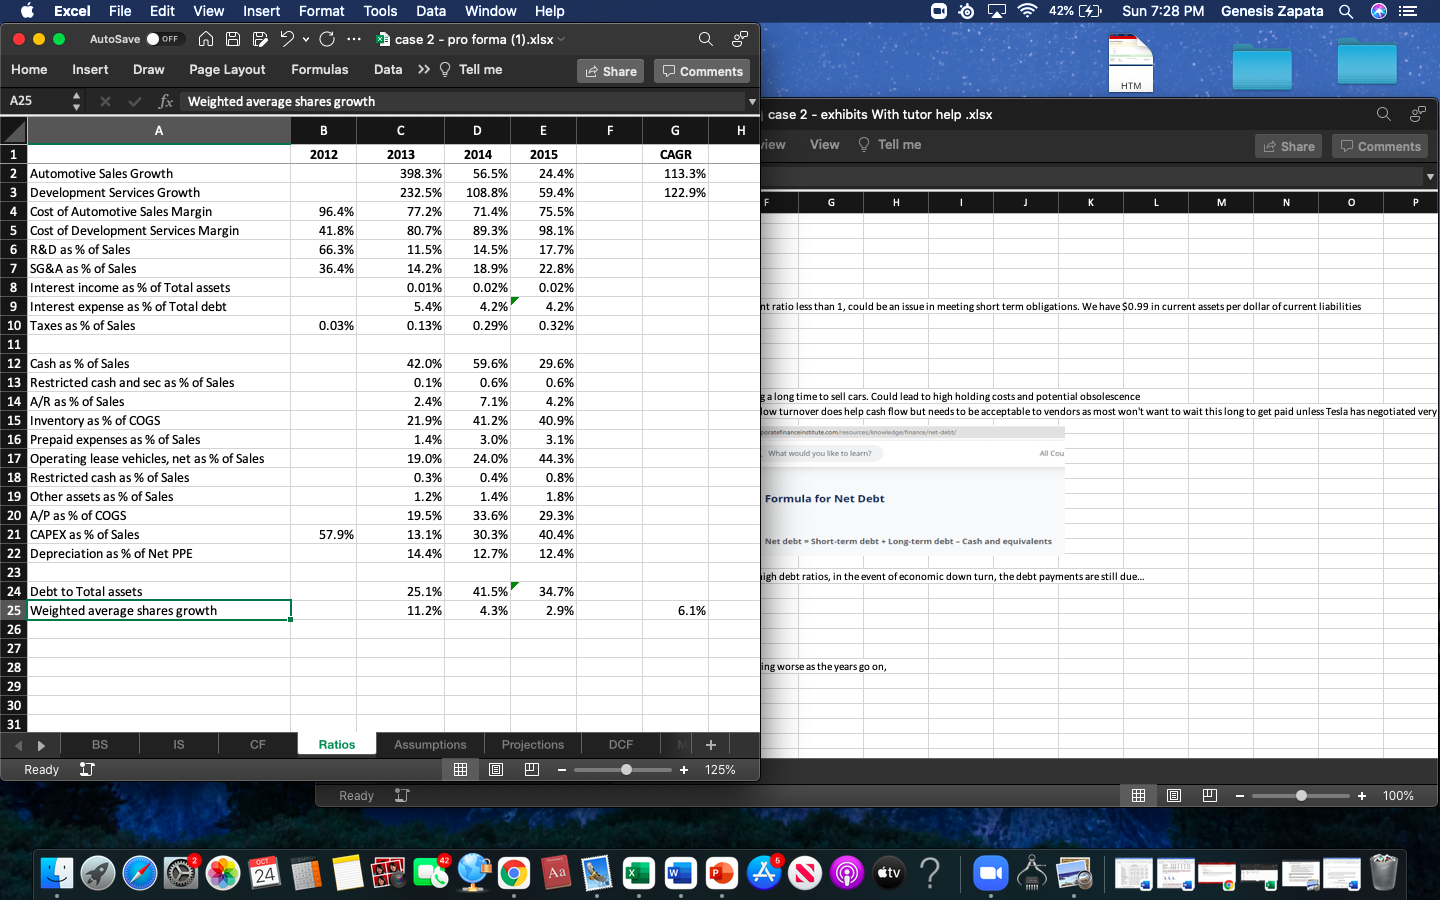
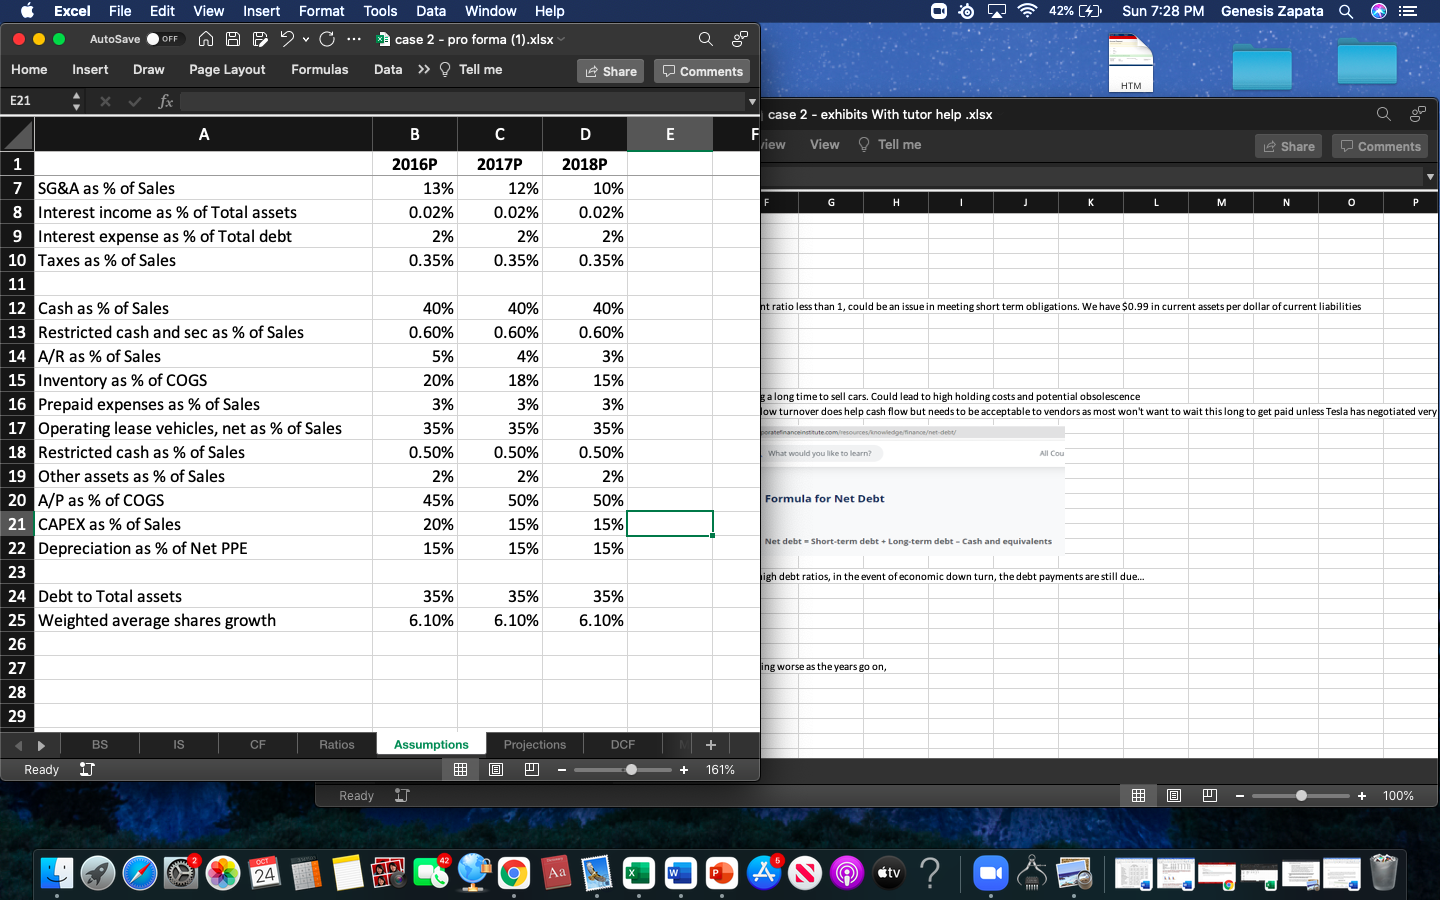
41% (4) Sun 7:26 PM Genesis Zapata a Excel File Edit View View Insert Format Format Tools AutoSave A.C... OFF Data Window Help case 2 - pro forma (1).xlsx Review View Tell me a Home Insert Draw Page Layout Formulas Data Share Comments C14 x fx 6435 A B D E F G H J K L M N 0 1 Share o Comments 2 3 3 4 Tesla Motors, Inc. Balance Sheet($ in thousands) 2013 2014 2015 M N 0 P 5 125.229 $ 845,889 $ $ 3,012 $ $ 49,109 $ $ 340,355 $ $ 27,574 $ $ 1,265,939 $ $ 382,425 $ $ 738,494 S $ $ 6,435 1$ $ 23,637 $ $ 2,416,930 $ 1,905,713 $ 1,196,908 17,947 $ 22,628 226,604 $ 168,965 953,675 $ 1,277,838 94,718 $ 3,198,657 $ 2,791,568 766,744 $ 1,791,403 1,829,267 $ 3,403,334 11,374 $ 31,522 43,209 $ 74,633 5,849,251 $ 8,092,460 n current assets per dollar of current liabilities Assets Current assets Cash and cash equivalents Restricted cash and marketable securities Accounts receivable Inventory Prepaid expenses and other current assets Total current assets Operating lease vehicles, net Property, plant and equipment, net Restricted cash Other assets Total assets Liabilities and Stockholders' Equity Current liabilities Accounts payable Accrued liabilities Deferred revenue Ilease obligations, current portion Customer deposits Convertible senior notes Total current liabilities Capital lease obligations, less current portion Deferred revenue, less current portion , Convertible senior notes, less current portion Resale value guarantee Other long-term liabilities Total liabilities Convertible senior notes (Notes 6) Total stockholders' equity Total liabilities and stockholders' equity ' 6 6 7 8 9 10 11 12 13 14 15 16 17 18 19 20 21 22 23 24 25 26 27 28 29 30 31 32 33 34 35 36 37 20 ant to wait this long to get paid unless Tesla has negotiated very $ 303,969 $ $ 108,252 $ $ 91,882 $ $ 7,722 $ $ 163,153 $ $ 182 $ $ 675,160 $ $ 12,855 $ $ 181,180 $ $ 586,119 $ $ 236,299 $ $ 58,197 $ $ 1,749,810 $ $ $ $ S 667,120 $ $ 2,416,930 $ 777,946 $ 916,148 268,884 $ 422,798 191,651 $ 423,961 9,532 $ 136,831 257,587 $ 283,370 601,566 $ 633,166 2,107,166 $ 2,816,274 12,267 292,271 $ 446,105 1,806,518 $ 2,040,375 487,879 $ 1,293,741 173,244 $ 364,976 4,879,345 $ 6,961,471 58,196 $ 42,045 911,710 $ 1,088,944 5,849,251 $ 8,092,460 BS IS CF Ratios Assumptions Projections DCF Multiples + Ready 1T @ 13 100% 96. BS IS CF #2 + Ready iT 13 + 100% 2 OCT 42 24 O w P A ity ? Excel File Edit 42% (4) Sun 7:27 PM Genesis Zapata Q View Insert Format Arc AutoSave OFF Tools Data Window Help case 2 - pro forma (1).xlsx Data >> Tell me Home Insert Draw Page Layout Formulas Share Comments HTM C23 fx -263815 case 2 - exhibits With tutor help.xlsx B D E F G G H Fiew View Tell me Share o Comments G H J K L M N 0 P ht ratio less than 1, could be an issue in meeting short term obligations. We have $0.99 in current assets per dollar of current liabilities galong time to sell cars. Could lead to high holding costs and potential obsolescence low turnover does help cash flow but needs to be acceptable to vendors as most won't want to wait this long to get paid unless Tesla has negotiated very 1 1 Tesla Motors, Inc. 2 Statement of Cash Flows 3 2012 2013 2014 2015 4 Net loss $ (396,213) $ (74,014) $ (294,040) $ (888,663) ( 5 Depreciation and amortization $ 28,825 $ 106,083 $ 231,931 $ 422,590 6 Stock-based compensation $ 50,145 $ 80,737 $ 156,496 $ 197,999 7 Inventory write-downs $ 4,929 $ 8,918 $ 15,609 $ 44,940 8 Amortization of DOE loan origination costs $ $ 5,558 $ $ 9 Change in fair value of DOE warrant liability $ 1,854 $ (10,692) $ $ 10 Fixed asset disposal $ 154 $ 1,796 $ 14,178 $ 37,723 11 Changes in operating assets and liabilities: 12 Accounts receivable $ (17,303) $ (21,705) $ (183,658) $ 46,267 13 Inventories and operating lease vehicles $ (194,726) $ (460,561) $ (1,050,264) $ (1,573,860) $ 14 Prepaid expenses and other current assets $ 1,121 $ $ (17,533) $ (60,637) $ (29,595) 15 Other assets $ (482) $ (434) $ (4,493) $ (24,362 16 Accounts payable $ 189,944 $ 20,995 $ 252,781 $ 263,345 17 Accrued liabilities $ S 9,603 $ 66,418 $ 162,075 $ 18 Deferred revenue $ (526) $ 268,098 $ 209,681 $ 322,203 19 Customer deposits $ 47,056 $ 24,354 $ 106,230 $ 36,721 20 Resale value guarantee $ $ 236,299 $ 249,492 $ 442,295 21 Other long-term liabilities $ 10,255 $ 33,027 $ 61,968 $ 23,697 22 Other $ 1.549 $ (2.540) $ 75,314 $ 154,201 23 Net cash provided by (used in) operating activities $ S $ (263,815)! 264,804 $ (57,337) $ (524,499) 24 Purchases of property and equipment excluding capital leases $ (239,228) $ (264,224) $ (969,885) $ (1,634,850) 25 Withdrawals out of dedicated DOE account, net $ 8,620 $ 14,752 $ $ $ 26 (Increase) decrease in other restricted cash $ (1,330) $ 55 $ (3,849) $ (26,441) 27 Purchases of short-term marketable securities $ $ (14,992) S - $ (205,841) $ 28 Maturities of short-term marketable securities $ 40,000 $ $ 189,131 $ (12,260) 29 Net cash used in Investing activities $ (206,930) $ (249,417) $ (990,444) $ (1,673,551) 30 Proceeds from issuance of convertible debt $ S 660,000 $ 2,300,000 $ 318,972 31 Proceeds from issuance of common stock in public offering $ 221,496 $ 360,000 $ $ 730,000 32 Proceeds from issuance of warrants $ $ 120,318 $ 389,160 $ 33 Proceeds from exercise of stock options and other stock issuances $ 24,885 $ 95,307 $ 100,455 $ 106,611 34 Proceeds from issuance of common stock in private placement $ S 55,000 $ - $ 20,000 35 Principal payments on DOE loans $ (12,710) $ (452,337) $ $ 36 Purchase of convertible note hedges $ $ (177,540) 5 (603,428) $ 37 Common stock and convertible debt issuance costs $ $ (16,901) $ (35,149) $ (17025) 38 Principal payments on capital leases and other debt $ (2,832) $ (8,425) $ (11,179) $ (203,780) 39 Collateralized lease borrowing $ $ $ 3,271 $ 568,745 40 Proceeds from DOE loans $ 188,796 $ $ - $ 41 Net cash provided by financing activities $ $ 419,635 $ 635,422 $ 2,143,130 $ 1,523,523 42 Effect of exchange rate changes on cash and cash equivalents $ (2,266) $ (6,810) $ (35,525) $ (34,278) 43 Net increase (decrease) in cash and cash equivalents $ (53,376) $ 643,999 $ 1,059,824 $ (708,805) 44 Cash and cash equivalents at beginning of period $ 255,266 $ 201,890 $ 845,889 $ 1,905,713 45 Cash and cash equivalents at end of period $ 201.890 $ 845,889 $ 1,905,713 S 1,196,90 46 portefinanceinstitute.com/resources/xnowledge/Tinanonet-debit What would you like to learn? All Cou Formula for Net Debt Net debt -Short-term debt +Long-term debt - Cash and equivalents + high debt ratios, in the event of economic down turn, the debt payments are still due... ing worse as the years go on, BS IS CF Ratios Assumptions Projections DCF + Ready IT 87% Ready 17 3 + 100% 2 OCT 42 24 O w P A S tv ? Excel File 42% (4) Sun 7:28 PM Genesis Zapata a Edit View View Insert Format Tools Data Window Help A C... case 2 - pro forma (1).xlsx AutoSave OFF Home Insert Draw Page Layout Formulas Data >> Tell me Share Comments HTM A25 fx Weighted average shares growth case 2 - exhibits With tutor help.xlsx A B B C D E E F F G H H riew View Tell me Share o Comments 2012 CAGR 113.3% 122.9% G H J K L M N 0 P 96.4% 41.8% 66.3% 36.4% 2013 398.3% 232.5% 77.2% 80.7% 11.5% 14.2% 0.01% 5.4% 0.13% 2014 56.5% 108.8% 71.4% 89.3% 14.5% 18.9% 0.02% 4.2% 0.29% 2015 24.4% 59.4% 75.5% 98.1% 17.7% 22.8% 0.02% 4.2% 0.32% ht ratio less than 1, could be an issue in meeting short term obligations. We have $0.99 in current assets per dollar of current liabilities 0.03% 29.6% 1 2 Automotive Sales Growth 3 Development Services Growth 4 Cost of Automotive Sales Margin 5 Cost of Development Services Margin 6 R&D as % of Sales 7 SG&A as % of Sales 8 Interest income as % of Total assets 9 Interest expense as % of Total debt 10 Taxes as % of Sales 11 12 Cash as % of Sales 13 Restricted cash and sec as % of Sales 14 A/R as % of Sales 15 Inventory as % of COGS 16 Prepaid expenses as % of Sales 17 Operating lease vehicles, net as % of Sales 18 Restricted cash as % of Sales 19 Other assets as % of Sales 20 A/P as % of COGS 21 CAPEX as % of Sales 22 Depreciation as % of Net PPE 23 24 Debt to Total assets 25 Weighted average shares growth 26 27 along time to sell cars. Could lead to high holding costs and potential obsolescence low turnover does help cash flow but needs to be acceptable to vendors as most won't want to wait this long to get paid unless Tesla has negotiated very portefinanceinstitute.com/resources/xnowledge/Tinanonet-debit 42.0% 0.1% 2.4% 21.9% 1.4% 19.0% 0.3% 1.2% 19.5% 13.1% What would you like to learn? All Cou 59.6% 0.6% 7.1% 41.2% 3.0% 24.0% 0.4% 1.4% 33.6% 30.3% 12.7% 0.6% 4.2% 40.9% 3.1% 44.3% 0.8% 1.8% 29.3% 40.4% 12.4% Formula for Net Debt 57.9% Net debt - Short-term debt +Long-term debt - Cash and equivalents + 14.4% high debt ratios, in the event of economic down turn, the debt payments are still due... 25.1% 11.2% 41.5% 4.3% 34.7% 2.9% 6.1% 28 ing worse as the years go on, 29 30 31 BS IS CF Ratios Assumptions Projections DCF + Ready IT 125% Ready 1 3 + 100% 2 OCT 42 24 O w P A 2 S tv ? Excel File Edit Tools Data Window Help 42% (4) Sun 7:28 PM Genesis Zapata a View Insert Format AO Pvc AutoSave OFF case 2 - pro forma (1).xlsx Home Insert Draw Page Layout Formulas Data >> Tell me Share Comments HTM E21 fx A B C case 2 - exhibits With tutor help.xlsx F riew View Tell me D E Share o Comments G K L M N O P 2016P 13% 0.02% 2% 0.35% 2017P 12% 0.02% 2% 0.35% 2018P 10% 0.02% 2% 0.35% ht ratio less than 1, could be an issue in meeting short term obligations. We have $0.99 in current assets per dollar of current liabilities 1 7 SG&A as % of Sales 8 Interest income as % of Total assets 9 Interest expense as % of Total debt 10 Taxes as % of Sales 11 12 Cash as % of Sales 13 Restricted cash and sec as % of Sales 14 A/R as % of Sales 15 Inventory as % of COGS 16 Prepaid expenses as % of Sales 17 Operating lease vehicles, net as % of Sales 18 Restricted cash as % of Sales 19 Other assets as % of Sales 20 A/P as % of COGS 21 CAPEX as % of Sales 22 Depreciation as % of Net PPE 23 24 Debt to Total assets 25 Weighted average shares growth 26 27 28 29 40% 0.60% 5% 20% 3% 35% 0.50% 2% 45% 20% 15% 40% 0.60% 4% 18% 3% 35% 0.50% 2% 50% 40% 0.60% 3% 15% 3% 35% 0.50% 2% 50% 15% 15% along time to sell cars. Could lead to high holding costs and potential obsolescence ow turnover does help cash flow but needs to be acceptable to vendors as most won't want to wait this long to get paid unless Tesla has negotiated very oratefinanceinstitute.com/resourcesowledge financeet-debt What would you like to learn? All Cou Formula for Net Debt 15% Net debt - Short-term debt +Long-term debt - Cash and equivalents 15% high debt ratios, in the event of economic down turn, the debt payments are still due... 35% 6.10% 35% 6.10% 35% 6.10% ing worse as the years go on, BS IS CF Ratios Assumptions DCF Projections Ready IT 161% Ready 11 100% 24 O 2 S tv ? Excel File Edit 42% (4) Sun 7:28 PM Genesis Zapata a View Insert Format Tools Data Window Help A.C... case 2 - pro forma (1).xlsx AutoSave OFF Home Insert Draw Page Layout Formulas Data >> Tell me Share Comments HTM B40 fx =B32*Assumptions!B24 case 2 - exhibits With tutor help.xlsx A B D view View Tell me Share o Comments 2016P 2,839,586 $ 2017P 4,263,302 $ 2018P 6,092,541 $ G K L M N O P $ $ $ 1,768,049 $ 692,339 $ 4,721,179 $ 136,022 1,787,909 $ 853,696 $ 6,079,323 $ 144,320 2,532,647 993,828 7,928,545 153,123 nt ratio less than 1, could be an issue in meeting short term obligations. We have $0.99 in current assets per dollar of current liabilities 1 35 Accounts Payable 36 37 Supplemental 38 CAPEX 39 Depreciation 40 Total debt 41 Weighted average shares 42 43 44 45 46 47 48 49 50 51 52 53 54 55 56 57 58 along time to sell cars. Could lead to high holding costs and potential obsolescence ow turnover does help cash flow but needs to be acceptable to vendors as most won't want to wait this long to get paid unless Tesla has negotiated very /xnowledge/Financeet-debit What would you like to learn? All Cou Formula for Net Debt Net debt -Short-term debt +Long-term debt - Cash and equivalents igh debt ratios, in the event of economic down turn, the debt payments are still due.. ing worse as the years go on, BS IS CF Ratios Assumptions Projections DCF + Ready IT a 150% Ready IT 100% 24 S tv ? Excel File Edit View Insert Format Tools Data Window Help 43% (4) Sun 7:29 PM Genesis Zapata a AutoSave OFF A evo case 2 - pro forma (1).xlsx Data Review View Tell me Home Insert Draw Page Layout Formulas Share Comments HTM G24 fx With tutor help .xlsx A B D E E F F G H Tell me Share o Comments $ 2016P 143,187 $ 21.6% 692,339 $ 1,768,049 $ 2017P 412,938 $ 14.2% 853,696 $ 1,787,909 $ 2018P 815,839 8.9% 993,828 2,532,647 $ $ . I J K L M N 0 P $ $ $ $ (273,047) $ 15,800 $ 1,923,438 $ 702,727 $ (34,763) $ (272,750) $ 1,423,716 $ 536,497 $ (29,754) (292,973) 1,829,238 710,681 be an issue in meeting short term obligations. We have $0.99 in current assets per dollar of current liabilities 1 627,434 $ 2 2 427,692 $ 3 505,849 $ Growth Rate WACC Terminal Value Enterprise Value Firm Value Equity Value Equity Value per Share 3% % 12.00% S 5,789,159 $ 7,350,134 $ 8,547,042 $ 5,736,670 $ 44.75 Could lead to high holding costs and potential obsolescence ash flow but needs to be acceptable to vendors as most won't want to wait this long to get paid unless Tesla has negotiated very 1 2 EBIT 3 Tax rate 4 Depreciation 5 CAPEX 6 Changes in operating accounts Accounts receivable originated 8 Inventory 9 Accounts payable 10 Free cash flow 11 12 Time Period 13 14 15 16 17 18 19 20 21 22 23 24 25 26 27 28 29 30 31 32 33 34 35 36 37 Knowledge/Financeet-debt All Cou ebt bt +Long-term debt - Cash and equivalents ent of economic down turn, the debt payments are still due... on, BS IS CF Ratios Assumptions Projections DCF Multiples + Ready IT 108% Ready 1T + 100% 2 OCT 42 24 O w P A tv ? Tools Data Window Help 44% (4) Sun 7:29 PM Genesis Zapata a Excel File Edit View View Insert Format AutoSave A evo OFF Q case 2 - pro forma (1).xlsx Data Review View Tell me Home Insert Draw Page Layout Formulas Share Comments HTM J7 fx tor help.xlsx . B C D E F G 2016P 2017P 2018P Share o Comments 2018P WACC Discounted Weight $ $ 195.22 $ 78.72 Projected Share Price EV/EBITDA Price-to-Earnings Price-to-Sales K I L J N M P 2,386,866 $ 8.0 19,094,928 $ 22,631,026 $ 17,909,847 $ 131.67 S 12.00% 12.00% 12.00% $ $ 2,979,848 $ 8.0 23,838,782 $ 28,606,538 $ 22,527,215 $ 156.09 $ 138.95 56.03 274.70 0 3,883,392 8.0 31,067,135 37,820,861 29,892,315 195.22 50% 0% 50% $ 385.93 RECO $ $ Multiples $ 206.83 $ we in meeting short term obligations. We have $0.99 in current assets per dollar of current liabilities 20,520 $ 20.0 410,398 $ 3.02 $ 253,108 $ 20.0 5,062,158 $ 35.08 $ 602,704 20.0 12,054,082 78.72 $ $ $ 1 2 EV/EBITDA 3 EBITDA 4 EV/EBITDA Multiple 5 Enterprise Value 6 Firm Value 7 Equity Value 8 Equity Value per Share 9 10 Price-to-Earnings 11 Net Income 12 Price-to-Earnings Multiple 13 Equity Value 14 Equity Value per Share 15 16 Price-to-Sales 17 Sales 18 Price-to-Sales Multiple 19 Equity Value 20 Equity Value per Share 21 22 23 24 25 26 27 28 29 30 31 32 33 34 35 36 37 38 39 8,840,245 s 3.5 30,940,856 $ 227.47 $ 11,919,391 $ 3.5 41,717,868 $ 289.07 $ 16,884,313 3.5 59,095,095 385.93 to high holding costs and potential obsolescence ut needs to be acceptable to vendors as most won't want to wait this long to get paid unless Tesla has negotiated very $ $ ret de All Cou erm debt - Cash and equivalents nomic down turn, the debt payments are still due... A0 BS IS CF Ratios Assumptions Projections DCF Multiples + Ready IT 100% Ready IT + 100% 2 OCT 42 24 O w P A tv ? 41% (4) Sun 7:26 PM Genesis Zapata a OFF Excel File Edit View View Insert Format Format Tools Data Window Help AutoSave AO C... case 2 - pro forma (1).xlsx Insert Draw Page Layout Formulas Data Review View Tell me a Home Share Comments B6 fx Development services A B D E E F G H I J K Share o Comments 1 2 3 4 Tesla Motors, Inc. Income Statement 2012 2013 2014 2015 M N 0 P $ $ $ 385,699 $ 1,921,877 $ 27,557 $ 91,619 $ 413,256 $ 2,013,496 $ 3,007,012 $ 3,740,973 191,344 $ 305,052 3,198,356 $ 4,046,025 n current assets per dollar of current liabilities 5 6 7 8 9 9 10 11 12 13 14 15 $ $ $ $ 371,658 $ 1,483,321 $ 11,531 $ 73,913 $ 383,189 $ 1,557,234 $ 30,067 $ 456,262 $ 2,145,749 $ 2,823,302 170,936 $ 299,220 2,316,685 $ 3,122,522 881,671 $ 923,503 ant to wait this long to get paid unless Tesla has negotiated very Revenues Automotive sales Development services Total revenues Cost of revenues Automotive sales Development services Total cost of revenues Gross profit Operating expenses Research and development Selling, general and administrative Total operating expenses Loss from operations Interest income interest expense Other income (expense), net Loss before income taxes Provision for income taxes Net loss Net loss per share of common stock, basic and diluted Weighted average shares 16 17 18 19 20 21 $ $ $ $ $ $ $ $ $ $ $ $ 273,978 $ 150,372 $ 424,350 $ (394,283) $ 288 $ (254) $ (1,828) $ (396,077) $ 136 $ (396,213) $ (3.69) $ 107,349 231,976 $ 285,569 $ 517,545 $ (61,283) $ 189 $ (32,934) $ 22,602 $ (71,426) $ 2,588 $ (74,014) $ (0.62) $ 119,421 464,700 $ 717,900 603,660 $ 922,232 1,068,360 $ 1,640,132 (186,689) $ (716,629) 1,126 $ 1,508 (100,886) $ (118,851) 1,813 $ (41,652) (284,636) $ (875,624) 9,404 $ 13,039 (294,040) $ (888,663) (2.36) $ (6.93) 124,539 128,202 22 23 24 25 26 27 28 BS IS CF Ratios Assumptions Projections DCF Multiples Ready 13 + 130% 96. BS IS CF #2 + Ready iT 13 + 100% 2 OCT 42 24 O w P A tv ? 41% (4) Sun 7:26 PM Genesis Zapata a Excel File Edit View View Insert Format Format Tools AutoSave A.C... OFF Data Window Help case 2 - pro forma (1).xlsx Review View Tell me a Home Insert Draw Page Layout Formulas Data Share Comments C14 x fx 6435 A B D E F G H J K L M N 0 1 Share o Comments 2 3 3 4 Tesla Motors, Inc. Balance Sheet($ in thousands) 2013 2014 2015 M N 0 P 5 125.229 $ 845,889 $ $ 3,012 $ $ 49,109 $ $ 340,355 $ $ 27,574 $ $ 1,265,939 $ $ 382,425 $ $ 738,494 S $ $ 6,435 1$ $ 23,637 $ $ 2,416,930 $ 1,905,713 $ 1,196,908 17,947 $ 22,628 226,604 $ 168,965 953,675 $ 1,277,838 94,718 $ 3,198,657 $ 2,791,568 766,744 $ 1,791,403 1,829,267 $ 3,403,334 11,374 $ 31,522 43,209 $ 74,633 5,849,251 $ 8,092,460 n current assets per dollar of current liabilities Assets Current assets Cash and cash equivalents Restricted cash and marketable securities Accounts receivable Inventory Prepaid expenses and other current assets Total current assets Operating lease vehicles, net Property, plant and equipment, net Restricted cash Other assets Total assets Liabilities and Stockholders' Equity Current liabilities Accounts payable Accrued liabilities Deferred revenue Ilease obligations, current portion Customer deposits Convertible senior notes Total current liabilities Capital lease obligations, less current portion Deferred revenue, less current portion , Convertible senior notes, less current portion Resale value guarantee Other long-term liabilities Total liabilities Convertible senior notes (Notes 6) Total stockholders' equity Total liabilities and stockholders' equity ' 6 6 7 8 9 10 11 12 13 14 15 16 17 18 19 20 21 22 23 24 25 26 27 28 29 30 31 32 33 34 35 36 37 20 ant to wait this long to get paid unless Tesla has negotiated very $ 303,969 $ $ 108,252 $ $ 91,882 $ $ 7,722 $ $ 163,153 $ $ 182 $ $ 675,160 $ $ 12,855 $ $ 181,180 $ $ 586,119 $ $ 236,299 $ $ 58,197 $ $ 1,749,810 $ $ $ $ S 667,120 $ $ 2,416,930 $ 777,946 $ 916,148 268,884 $ 422,798 191,651 $ 423,961 9,532 $ 136,831 257,587 $ 283,370 601,566 $ 633,166 2,107,166 $ 2,816,274 12,267 292,271 $ 446,105 1,806,518 $ 2,040,375 487,879 $ 1,293,741 173,244 $ 364,976 4,879,345 $ 6,961,471 58,196 $ 42,045 911,710 $ 1,088,944 5,849,251 $ 8,092,460 BS IS CF Ratios Assumptions Projections DCF Multiples + Ready 1T @ 13 100% 96. BS IS CF #2 + Ready iT 13 + 100% 2 OCT 42 24 O w P A ity ? Excel File Edit 42% (4) Sun 7:27 PM Genesis Zapata Q View Insert Format Arc AutoSave OFF Tools Data Window Help case 2 - pro forma (1).xlsx Data >> Tell me Home Insert Draw Page Layout Formulas Share Comments HTM C23 fx -263815 case 2 - exhibits With tutor help.xlsx B D E F G G H Fiew View Tell me Share o Comments G H J K L M N 0 P ht ratio less than 1, could be an issue in meeting short term obligations. We have $0.99 in current assets per dollar of current liabilities galong time to sell cars. Could lead to high holding costs and potential obsolescence low turnover does help cash flow but needs to be acceptable to vendors as most won't want to wait this long to get paid unless Tesla has negotiated very 1 1 Tesla Motors, Inc. 2 Statement of Cash Flows 3 2012 2013 2014 2015 4 Net loss $ (396,213) $ (74,014) $ (294,040) $ (888,663) ( 5 Depreciation and amortization $ 28,825 $ 106,083 $ 231,931 $ 422,590 6 Stock-based compensation $ 50,145 $ 80,737 $ 156,496 $ 197,999 7 Inventory write-downs $ 4,929 $ 8,918 $ 15,609 $ 44,940 8 Amortization of DOE loan origination costs $ $ 5,558 $ $ 9 Change in fair value of DOE warrant liability $ 1,854 $ (10,692) $ $ 10 Fixed asset disposal $ 154 $ 1,796 $ 14,178 $ 37,723 11 Changes in operating assets and liabilities: 12 Accounts receivable $ (17,303) $ (21,705) $ (183,658) $ 46,267 13 Inventories and operating lease vehicles $ (194,726) $ (460,561) $ (1,050,264) $ (1,573,860) $ 14 Prepaid expenses and other current assets $ 1,121 $ $ (17,533) $ (60,637) $ (29,595) 15 Other assets $ (482) $ (434) $ (4,493) $ (24,362 16 Accounts payable $ 189,944 $ 20,995 $ 252,781 $ 263,345 17 Accrued liabilities $ S 9,603 $ 66,418 $ 162,075 $ 18 Deferred revenue $ (526) $ 268,098 $ 209,681 $ 322,203 19 Customer deposits $ 47,056 $ 24,354 $ 106,230 $ 36,721 20 Resale value guarantee $ $ 236,299 $ 249,492 $ 442,295 21 Other long-term liabilities $ 10,255 $ 33,027 $ 61,968 $ 23,697 22 Other $ 1.549 $ (2.540) $ 75,314 $ 154,201 23 Net cash provided by (used in) operating activities $ S $ (263,815)! 264,804 $ (57,337) $ (524,499) 24 Purchases of property and equipment excluding capital leases $ (239,228) $ (264,224) $ (969,885) $ (1,634,850) 25 Withdrawals out of dedicated DOE account, net $ 8,620 $ 14,752 $ $ $ 26 (Increase) decrease in other restricted cash $ (1,330) $ 55 $ (3,849) $ (26,441) 27 Purchases of short-term marketable securities $ $ (14,992) S - $ (205,841) $ 28 Maturities of short-term marketable securities $ 40,000 $ $ 189,131 $ (12,260) 29 Net cash used in Investing activities $ (206,930) $ (249,417) $ (990,444) $ (1,673,551) 30 Proceeds from issuance of convertible debt $ S 660,000 $ 2,300,000 $ 318,972 31 Proceeds from issuance of common stock in public offering $ 221,496 $ 360,000 $ $ 730,000 32 Proceeds from issuance of warrants $ $ 120,318 $ 389,160 $ 33 Proceeds from exercise of stock options and other stock issuances $ 24,885 $ 95,307 $ 100,455 $ 106,611 34 Proceeds from issuance of common stock in private placement $ S 55,000 $ - $ 20,000 35 Principal payments on DOE loans $ (12,710) $ (452,337) $ $ 36 Purchase of convertible note hedges $ $ (177,540) 5 (603,428) $ 37 Common stock and convertible debt issuance costs $ $ (16,901) $ (35,149) $ (17025) 38 Principal payments on capital leases and other debt $ (2,832) $ (8,425) $ (11,179) $ (203,780) 39 Collateralized lease borrowing $ $ $ 3,271 $ 568,745 40 Proceeds from DOE loans $ 188,796 $ $ - $ 41 Net cash provided by financing activities $ $ 419,635 $ 635,422 $ 2,143,130 $ 1,523,523 42 Effect of exchange rate changes on cash and cash equivalents $ (2,266) $ (6,810) $ (35,525) $ (34,278) 43 Net increase (decrease) in cash and cash equivalents $ (53,376) $ 643,999 $ 1,059,824 $ (708,805) 44 Cash and cash equivalents at beginning of period $ 255,266 $ 201,890 $ 845,889 $ 1,905,713 45 Cash and cash equivalents at end of period $ 201.890 $ 845,889 $ 1,905,713 S 1,196,90 46 portefinanceinstitute.com/resources/xnowledge/Tinanonet-debit What would you like to learn? All Cou Formula for Net Debt Net debt -Short-term debt +Long-term debt - Cash and equivalents + high debt ratios, in the event of economic down turn, the debt payments are still due... ing worse as the years go on, BS IS CF Ratios Assumptions Projections DCF + Ready IT 87% Ready 17 3 + 100% 2 OCT 42 24 O w P A S tv ? Excel File 42% (4) Sun 7:28 PM Genesis Zapata a Edit View View Insert Format Tools Data Window Help A C... case 2 - pro forma (1).xlsx AutoSave OFF Home Insert Draw Page Layout Formulas Data >> Tell me Share Comments HTM A25 fx Weighted average shares growth case 2 - exhibits With tutor help.xlsx A B B C D E E F F G H H riew View Tell me Share o Comments 2012 CAGR 113.3% 122.9% G H J K L M N 0 P 96.4% 41.8% 66.3% 36.4% 2013 398.3% 232.5% 77.2% 80.7% 11.5% 14.2% 0.01% 5.4% 0.13% 2014 56.5% 108.8% 71.4% 89.3% 14.5% 18.9% 0.02% 4.2% 0.29% 2015 24.4% 59.4% 75.5% 98.1% 17.7% 22.8% 0.02% 4.2% 0.32% ht ratio less than 1, could be an issue in meeting short term obligations. We have $0.99 in current assets per dollar of current liabilities 0.03% 29.6% 1 2 Automotive Sales Growth 3 Development Services Growth 4 Cost of Automotive Sales Margin 5 Cost of Development Services Margin 6 R&D as % of Sales 7 SG&A as % of Sales 8 Interest income as % of Total assets 9 Interest expense as % of Total debt 10 Taxes as % of Sales 11 12 Cash as % of Sales 13 Restricted cash and sec as % of Sales 14 A/R as % of Sales 15 Inventory as % of COGS 16 Prepaid expenses as % of Sales 17 Operating lease vehicles, net as % of Sales 18 Restricted cash as % of Sales 19 Other assets as % of Sales 20 A/P as % of COGS 21 CAPEX as % of Sales 22 Depreciation as % of Net PPE 23 24 Debt to Total assets 25 Weighted average shares growth 26 27 along time to sell cars. Could lead to high holding costs and potential obsolescence low turnover does help cash flow but needs to be acceptable to vendors as most won't want to wait this long to get paid unless Tesla has negotiated very portefinanceinstitute.com/resources/xnowledge/Tinanonet-debit 42.0% 0.1% 2.4% 21.9% 1.4% 19.0% 0.3% 1.2% 19.5% 13.1% What would you like to learn? All Cou 59.6% 0.6% 7.1% 41.2% 3.0% 24.0% 0.4% 1.4% 33.6% 30.3% 12.7% 0.6% 4.2% 40.9% 3.1% 44.3% 0.8% 1.8% 29.3% 40.4% 12.4% Formula for Net Debt 57.9% Net debt - Short-term debt +Long-term debt - Cash and equivalents + 14.4% high debt ratios, in the event of economic down turn, the debt payments are still due... 25.1% 11.2% 41.5% 4.3% 34.7% 2.9% 6.1% 28 ing worse as the years go on, 29 30 31 BS IS CF Ratios Assumptions Projections DCF + Ready IT 125% Ready 1 3 + 100% 2 OCT 42 24 O w P A 2 S tv ? Excel File Edit Tools Data Window Help 42% (4) Sun 7:28 PM Genesis Zapata a View Insert Format AO Pvc AutoSave OFF case 2 - pro forma (1).xlsx Home Insert Draw Page Layout Formulas Data >> Tell me Share Comments HTM E21 fx A B C case 2 - exhibits With tutor help.xlsx F riew View Tell me D E Share o Comments G K L M N O P 2016P 13% 0.02% 2% 0.35% 2017P 12% 0.02% 2% 0.35% 2018P 10% 0.02% 2% 0.35% ht ratio less than 1, could be an issue in meeting short term obligations. We have $0.99 in current assets per dollar of current liabilities 1 7 SG&A as % of Sales 8 Interest income as % of Total assets 9 Interest expense as % of Total debt 10 Taxes as % of Sales 11 12 Cash as % of Sales 13 Restricted cash and sec as % of Sales 14 A/R as % of Sales 15 Inventory as % of COGS 16 Prepaid expenses as % of Sales 17 Operating lease vehicles, net as % of Sales 18 Restricted cash as % of Sales 19 Other assets as % of Sales 20 A/P as % of COGS 21 CAPEX as % of Sales 22 Depreciation as % of Net PPE 23 24 Debt to Total assets 25 Weighted average shares growth 26 27 28 29 40% 0.60% 5% 20% 3% 35% 0.50% 2% 45% 20% 15% 40% 0.60% 4% 18% 3% 35% 0.50% 2% 50% 40% 0.60% 3% 15% 3% 35% 0.50% 2% 50% 15% 15% along time to sell cars. Could lead to high holding costs and potential obsolescence ow turnover does help cash flow but needs to be acceptable to vendors as most won't want to wait this long to get paid unless Tesla has negotiated very oratefinanceinstitute.com/resourcesowledge financeet-debt What would you like to learn? All Cou Formula for Net Debt 15% Net debt - Short-term debt +Long-term debt - Cash and equivalents 15% high debt ratios, in the event of economic down turn, the debt payments are still due... 35% 6.10% 35% 6.10% 35% 6.10% ing worse as the years go on, BS IS CF Ratios Assumptions DCF Projections Ready IT 161% Ready 11 100% 24 O 2 S tv ? Excel File Edit 42% (4) Sun 7:28 PM Genesis Zapata a View Insert Format Tools Data Window Help A.C... case 2 - pro forma (1).xlsx AutoSave OFF Home Insert Draw Page Layout Formulas Data >> Tell me Share Comments HTM B40 fx =B32*Assumptions!B24 case 2 - exhibits With tutor help.xlsx A B D view View Tell me Share o Comments 2016P 2,839,586 $ 2017P 4,263,302 $ 2018P 6,092,541 $ G K L M N O P $ $ $ 1,768,049 $ 692,339 $ 4,721,179 $ 136,022 1,787,909 $ 853,696 $ 6,079,323 $ 144,320 2,532,647 993,828 7,928,545 153,123 nt ratio less than 1, could be an issue in meeting short term obligations. We have $0.99 in current assets per dollar of current liabilities 1 35 Accounts Payable 36 37 Supplemental 38 CAPEX 39 Depreciation 40 Total debt 41 Weighted average shares 42 43 44 45 46 47 48 49 50 51 52 53 54 55 56 57 58 along time to sell cars. Could lead to high holding costs and potential obsolescence ow turnover does help cash flow but needs to be acceptable to vendors as most won't want to wait this long to get paid unless Tesla has negotiated very /xnowledge/Financeet-debit What would you like to learn? All Cou Formula for Net Debt Net debt -Short-term debt +Long-term debt - Cash and equivalents igh debt ratios, in the event of economic down turn, the debt payments are still due.. ing worse as the years go on, BS IS CF Ratios Assumptions Projections DCF + Ready IT a 150% Ready IT 100% 24 S tv ? Excel File Edit View Insert Format Tools Data Window Help 43% (4) Sun 7:29 PM Genesis Zapata a AutoSave OFF A evo case 2 - pro forma (1).xlsx Data Review View Tell me Home Insert Draw Page Layout Formulas Share Comments HTM G24 fx With tutor help .xlsx A B D E E F F G H Tell me Share o Comments $ 2016P 143,187 $ 21.6% 692,339 $ 1,768,049 $ 2017P 412,938 $ 14.2% 853,696 $ 1,787,909 $ 2018P 815,839 8.9% 993,828 2,532,647 $ $ . I J K L M N 0 P $ $ $ $ (273,047) $ 15,800 $ 1,923,438 $ 702,727 $ (34,763) $ (272,750) $ 1,423,716 $ 536,497 $ (29,754) (292,973) 1,829,238 710,681 be an issue in meeting short term obligations. We have $0.99 in current assets per dollar of current liabilities 1 627,434 $ 2 2 427,692 $ 3 505,849 $ Growth Rate WACC Terminal Value Enterprise Value Firm Value Equity Value Equity Value per Share 3% % 12.00% S 5,789,159 $ 7,350,134 $ 8,547,042 $ 5,736,670 $ 44.75 Could lead to high holding costs and potential obsolescence ash flow but needs to be acceptable to vendors as most won't want to wait this long to get paid unless Tesla has negotiated very 1 2 EBIT 3 Tax rate 4 Depreciation 5 CAPEX 6 Changes in operating accounts Accounts receivable originated 8 Inventory 9 Accounts payable 10 Free cash flow 11 12 Time Period 13 14 15 16 17 18 19 20 21 22 23 24 25 26 27 28 29 30 31 32 33 34 35 36 37 Knowledge/Financeet-debt All Cou ebt bt +Long-term debt - Cash and equivalents ent of economic down turn, the debt payments are still due... on, BS IS CF Ratios Assumptions Projections DCF Multiples + Ready IT 108% Ready 1T + 100% 2 OCT 42 24 O w P A tv ? Tools Data Window Help 44% (4) Sun 7:29 PM Genesis Zapata a Excel File Edit View View Insert Format AutoSave A evo OFF Q case 2 - pro forma (1).xlsx Data Review View Tell me Home Insert Draw Page Layout Formulas Share Comments HTM J7 fx tor help.xlsx . B C D E F G 2016P 2017P 2018P Share o Comments 2018P WACC Discounted Weight $ $ 195.22 $ 78.72 Projected Share Price EV/EBITDA Price-to-Earnings Price-to-Sales K I L J N M P 2,386,866 $ 8.0 19,094,928 $ 22,631,026 $ 17,909,847 $ 131.67 S 12.00% 12.00% 12.00% $ $ 2,979,848 $ 8.0 23,838,782 $ 28,606,538 $ 22,527,215 $ 156.09 $ 138.95 56.03 274.70 0 3,883,392 8.0 31,067,135 37,820,861 29,892,315 195.22 50% 0% 50% $ 385.93 RECO $ $ Multiples $ 206.83 $ we in meeting short term obligations. We have $0.99 in current assets per dollar of current liabilities 20,520 $ 20.0 410,398 $ 3.02 $ 253,108 $ 20.0 5,062,158 $ 35.08 $ 602,704 20.0 12,054,082 78.72 $ $ $ 1 2 EV/EBITDA 3 EBITDA 4 EV/EBITDA Multiple 5 Enterprise Value 6 Firm Value 7 Equity Value 8 Equity Value per Share 9 10 Price-to-Earnings 11 Net Income 12 Price-to-Earnings Multiple 13 Equity Value 14 Equity Value per Share 15 16 Price-to-Sales 17 Sales 18 Price-to-Sales Multiple 19 Equity Value 20 Equity Value per Share 21 22 23 24 25 26 27 28 29 30 31 32 33 34 35 36 37 38 39 8,840,245 s 3.5 30,940,856 $ 227.47 $ 11,919,391 $ 3.5 41,717,868 $ 289.07 $ 16,884,313 3.5 59,095,095 385.93 to high holding costs and potential obsolescence ut needs to be acceptable to vendors as most won't want to wait this long to get paid unless Tesla has negotiated very $ $ ret de All Cou erm debt - Cash and equivalents nomic down turn, the debt payments are still due... A0 BS IS CF Ratios Assumptions Projections DCF Multiples + Ready IT 100% Ready IT + 100% 2 OCT 42 24 O w P A tv ? 41% (4) Sun 7:26 PM Genesis Zapata a OFF Excel File Edit View View Insert Format Format Tools Data Window Help AutoSave AO C... case 2 - pro forma (1).xlsx Insert Draw Page Layout Formulas Data Review View Tell me a Home Share Comments B6 fx Development services A B D E E F G H I J K Share o Comments 1 2 3 4 Tesla Motors, Inc. Income Statement 2012 2013 2014 2015 M N 0 P $ $ $ 385,699 $ 1,921,877 $ 27,557 $ 91,619 $ 413,256 $ 2,013,496 $ 3,007,012 $ 3,740,973 191,344 $ 305,052 3,198,356 $ 4,046,025 n current assets per dollar of current liabilities 5 6 7 8 9 9 10 11 12 13 14 15 $ $ $ $ 371,658 $ 1,483,321 $ 11,531 $ 73,913 $ 383,189 $ 1,557,234 $ 30,067 $ 456,262 $ 2,145,749 $ 2,823,302 170,936 $ 299,220 2,316,685 $ 3,122,522 881,671 $ 923,503 ant to wait this long to get paid unless Tesla has negotiated very Revenues Automotive sales Development services Total revenues Cost of revenues Automotive sales Development services Total cost of revenues Gross profit Operating expenses Research and development Selling, general and administrative Total operating expenses Loss from operations Interest income interest expense Other income (expense), net Loss before income taxes Provision for income taxes Net loss Net loss per share of common stock, basic and diluted Weighted average shares 16 17 18 19 20 21 $ $ $ $ $ $ $ $ $ $ $ $ 273,978 $ 150,372 $ 424,350 $ (394,283) $ 288 $ (254) $ (1,828) $ (396,077) $ 136 $ (396,213) $ (3.69) $ 107,349 231,976 $ 285,569 $ 517,545 $ (61,283) $ 189 $ (32,934) $ 22,602 $ (71,426) $ 2,588 $ (74,014) $ (0.62) $ 119,421 464,700 $ 717,900 603,660 $ 922,232 1,068,360 $ 1,640,132 (186,689) $ (716,629) 1,126 $ 1,508 (100,886) $ (118,851) 1,813 $ (41,652) (284,636) $ (875,624) 9,404 $ 13,039 (294,040) $ (888,663) (2.36) $ (6.93) 124,539 128,202 22 23 24 25 26 27 28 BS IS CF Ratios Assumptions Projections DCF Multiples Ready 13 + 130% 96. BS IS CF #2 + Ready iT 13 + 100% 2 OCT 42 24 O w P A tv


