

Answered step by step
Verified Expert Solution
Question
1 Approved Answer
Develope a python program to analyze the GDP data This is the GDP.txt Table 1.1.1. Percent Change From Preceding Period in Real Gross Domestic Product
Develope a python program to analyze the GDP data
This is the GDP.txt
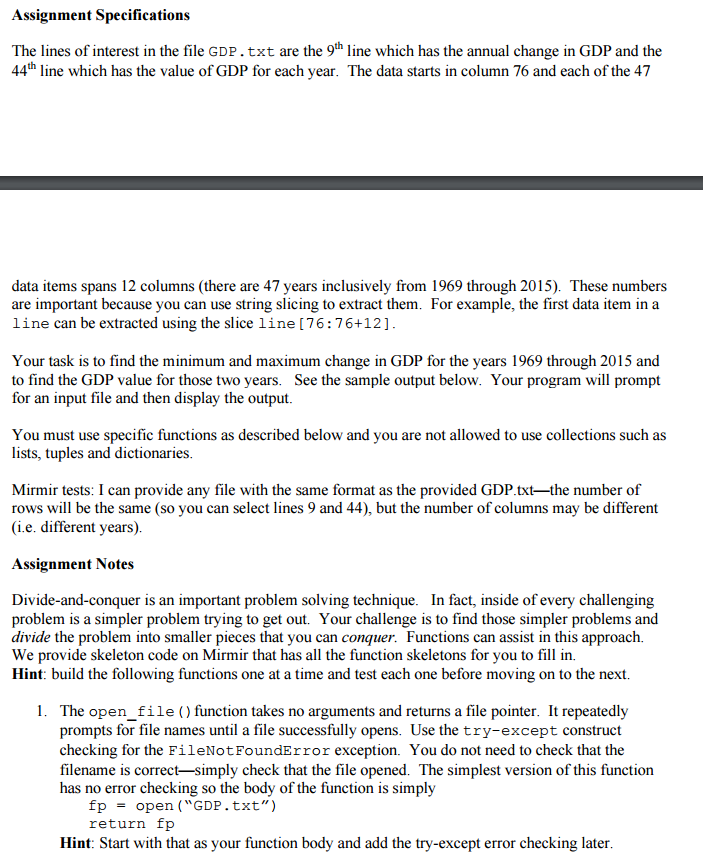
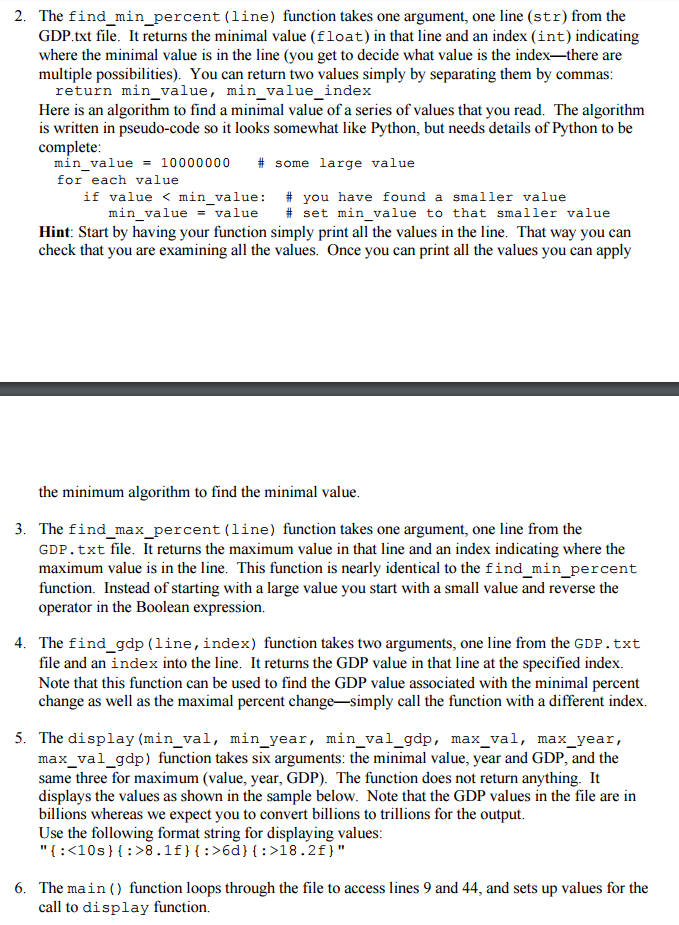
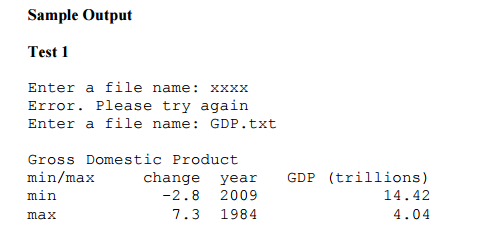
Table 1.1.1. Percent Change From Preceding Period in Real Gross Domestic Product [Percent] Annual data from 1969 To 2015 Bureau of Economic Analysis Data published August 26, 2016 File created 8/25/2016 1:54:40 PM Line 1969 1970 1971 1972 1973 1974 1975 1976 1977 1978 1979 1980 1981 1982 1983 1984 1985 1986 1987 1988 1989 1990 1991 1992 1993 1994 1995 1996 1997 1998 1999 2000 2001 2002 2003 2004 2005 2006 2007 2008 2009 2010 2011 2012 2013 2014 2015 1 Gross domestic product A191RL1 3.1 0.2 3.3 5.2 5.6 -0.5 -0.2 5.4 4.6 5.6 3.2 -0.2 2.6 -1.9 4.6 7.3 4.2 3.5 3.5 4.2 3.7 1.9 -0.1 3.6 2.7 4.0 2.7 3.8 4.5 4.5 4.7 4.1 1.0 1.8 2.8 3.8 3.3 2.7 1.8 -0.3 -2.8 2.5 1.6 2.2 1.7 2.4 2.6 2 Personal consumption expenditures DPCERL1 3.7 2.4 3.8 6.1 5.0 -0.8 2.3 5.6 4.2 4.4 2.4 -0.3 1.5 1.4 5.7 5.3 5.3 4.2 3.4 4.2 2.9 2.1 0.2 3.7 3.5 3.9 3.0 3.5 3.8 5.3 5.3 5.1 2.6 2.6 3.1 3.8 3.5 3.0 2.2 -0.3 -1.6 1.9 2.3 1.5 1.5 2.9 3.2 3 Goods DGDSRL1 3.1 0.8 4.2 6.5 5.2 -3.6 0.7 7.0 4.3 4.1 1.6 -2.5 1.2 0.7 6.4 7.2 5.3 5.6 1.8 3.7 2.5 0.6 -2.0 3.2 4.2 5.3 3.0 4.5 4.8 6.7 7.9 5.2 3.0 3.9 4.8 5.1 4.1 3.6 2.7 -2.5 -3.0 3.4 3.1 2.7 3.1 3.9 4.0 4 Durable goods DDURRL1 3.7 -2.7 10.0 12.4 10.5 -6.4 0.2 12.5 8.8 5.2 -0.5 -8.0 1.0 -0.2 14.3 14.3 10.0 9.6 2.0 5.7 2.2 -0.4 -5.4 5.7 7.5 8.0 3.9 7.5 8.2 12.1 12.8 8.6 5.2 7.3 7.1 8.2 5.4 4.3 4.6 -5.1 -5.5 6.1 6.1 7.4 6.2 6.7 6.9 5 Nondurable goods DNDGRL1 2.8 2.2 1.9 4.0 2.9 -2.4 0.9 4.8 2.3 3.6 2.6 -0.2 1.3 1.0 3.3 4.1 3.0 3.6 1.7 2.6 2.7 1.2 -0.3 1.9 2.5 3.9 2.5 2.9 2.9 3.7 5.0 3.2 1.7 1.9 3.5 3.3 3.3 3.3 1.7 -1.1 -1.8 2.2 1.8 0.6 1.7 2.6 2.6 6 Services DSERRL1 4.4 3.9 3.5 5.8 4.7 1.9 3.8 4.3 4.1 4.6 3.1 1.6 1.7 2.0 5.2 3.9 5.3 3.2 4.5 4.5 3.2 3.0 1.6 4.0 3.1 3.1 3.0 2.9 3.2 4.6 3.9 5.0 2.4 1.9 2.2 3.2 3.2 2.7 2.0 0.8 -0.9 1.2 1.8 0.8 0.6 2.3 2.8 7 Gross private domestic investment A006RL1 5.6 -6.1 10.3 11.3 10.9 -6.6 -16.2 19.1 14.3 11.6 3.5 -10.1 8.8 -13.0 9.3 27.3 -0.1 0.2 2.8 2.5 4.0 -2.6 -6.6 7.3 8.0 11.9 3.2 8.8 11.4 9.5 8.4 6.5 -6.1 -0.6 4.1 8.8 6.4 2.1 -3.1 -9.4 -21.6 12.9 5.2 10.6 6.1 4.5 5.0 8 Fixed investment A007RL1 5.9 -2.1 6.9 11.4 8.6 -5.6 -9.8 9.8 13.6 11.6 5.8 -5.9 2.7 -6.7 7.5 16.2 5.5 1.8 0.6 3.3 3.2 -1.4 -5.1 5.5 7.7 8.2 6.1 8.9 8.6 10.2 8.8 6.9 -1.6 -3.5 4.0 6.7 6.8 2.0 -2.0 -6.8 -16.7 1.5 6.3 9.8 5.0 5.5 4.0 9 Nonresidential A008RL1 7.0 -0.9 0.0 8.7 13.2 0.8 -9.0 5.7 10.8 13.8 10.0 0.0 6.1 -3.6 -0.4 16.7 6.6 -1.7 0.1 5.0 5.7 1.1 -3.9 2.9 7.5 7.9 9.7 9.1 10.8 10.8 9.7 9.1 -2.4 -6.9 1.9 5.2 7.0 7.1 5.9 -0.7 -15.6 2.5 7.7 9.0 3.5 6.0 2.1 10 Structures A009RL1 5.4 0.3 -1.6 3.1 8.2 -2.2 -10.5 2.4 4.1 14.4 12.7 5.9 8.0 -1.6 -10.8 13.9 7.1 -11.0 -2.9 0.7 2.0 1.5 -11.1 -6.0 -0.3 1.8 6.4 5.7 7.3 5.1 0.1 7.8 -1.5 -17.7 -3.9 -0.4 1.7 7.2 12.7 6.1 -18.9 -16.4 2.3 12.9 1.4 10.3 -4.4 11 Equipment Y033RL1 8.3 -1.8 0.8 12.7 18.5 2.1 -10.5 6.1 15.5 15.1 8.2 -4.4 3.7 -7.6 4.6 19.4 5.5 1.1 0.4 6.6 5.3 -2.1 -4.6 5.9 12.7 12.3 12.1 9.5 11.1 13.1 12.5 9.7 -4.3 -5.4 3.2 7.7 9.6 8.6 3.2 -6.9 -22.9 15.9 13.6 10.8 4.6 5.4 3.5 12 Intellectual property products Y001RL1 5.4 -0.1 0.4 7.0 5.0 2.9 0.9 10.9 6.6 7.1 11.7 5.0 10.9 6.2 7.9 13.7 9.0 7.0 3.9 7.1 11.7 8.4 6.4 6.0 4.2 4.0 7.3 11.3 13.0 10.8 12.4 8.9 0.5 -0.5 3.8 5.1 6.5 4.5 4.8 3.0 -1.4 1.9 3.6 3.9 3.4 3.9 4.8 13 Residential A011RL1 3.1 -5.2 26.6 17.4 -0.6 -19.6 -12.1 22.1 20.5 6.7 -3.7 -20.9 -8.2 -18.1 42.0 14.8 2.3 12.4 2.0 -0.9 -3.2 -8.5 -8.9 13.8 8.2 9.0 -3.4 8.2 2.4 8.6 6.3 0.7 0.9 6.1 9.1 10.0 6.6 -7.6 -18.8 -24.0 -21.2 -2.5 0.5 13.5 11.9 3.5 11.7 14 Change in private inventories ZZZZZZ1 ..... ..... ..... ..... ..... ..... ..... ..... ..... ..... ..... ..... ..... ..... ..... ..... ..... ..... ..... ..... ..... ..... ..... ..... ..... ..... ..... ..... ..... ..... ..... ..... ..... ..... ..... ..... ..... ..... ..... ..... ..... ..... ..... ..... ..... ..... ..... 15 Net exports of goods and services ZZZZZZ1 ..... ..... ..... ..... ..... ..... ..... ..... ..... ..... ..... ..... ..... ..... ..... ..... ..... ..... ..... ..... ..... ..... ..... ..... ..... ..... ..... ..... ..... ..... ..... ..... ..... ..... ..... ..... ..... ..... ..... ..... ..... ..... ..... ..... ..... ..... ..... 16 Exports A020RL1 4.9 10.7 1.7 7.8 18.8 7.9 -0.6 4.4 2.4 10.5 9.9 10.8 1.2 -7.6 -2.6 8.2 3.3 7.7 10.9 16.2 11.6 8.8 6.6 6.9 3.3 8.8 10.3 8.2 11.9 2.3 2.6 8.6 -5.8 -1.7 1.8 9.8 6.3 9.0 9.3 5.7 -8.8 11.9 6.9 3.4 3.5 4.3 0.1 17 Goods A253RL1 5.2 11.2 -0.1 10.9 24.5 8.5 -2.1 5.1 1.9 10.4 10.6 12.3 -0.6 -8.5 -3.2 7.1 3.5 5.4 12.2 17.8 11.4 8.6 6.7 7.5 3.2 9.6 11.6 8.9 14.5 2.2 4.2 10.1 -6.2 -3.4 1.9 8.6 7.3 9.4 7.5 6.1 -12.1 14.4 6.5 3.6 3.1 4.4 -0.6 18 Services A646RL1 3.9 9.0 7.3 -0.4 1.7 5.4 5.9 1.1 4.5 11.2 7.1 4.2 9.8 -4.4 -0.2 11.8 2.8 14.4 7.6 11.9 12.0 9.5 6.4 5.4 3.3 7.0 6.8 6.3 5.3 2.8 -1.4 4.7 -5.0 2.7 1.5 12.7 3.8 8.1 13.7 4.8 -1.1 6.8 7.6 3.0 4.4 3.9 1.6 19 Imports A021RL1 5.7 4.3 5.3 11.3 4.6 -2.3 -11.1 19.5 10.9 8.7 1.7 -6.6 2.6 -1.3 12.6 24.3 6.5 8.5 5.9 3.9 4.4 3.6 -0.1 7.0 8.6 11.9 8.0 8.7 13.5 11.7 10.1 13.0 -2.8 3.7 4.5 11.4 6.3 6.3 2.5 -2.6 -13.7 12.7 5.5 2.2 1.1 4.4 4.6 20 Goods A255RL1 5.5 3.9 8.4 13.6 7.1 -2.8 -12.6 22.6 12.2 9.0 1.7 -7.4 2.1 -2.5 13.6 24.2 6.3 10.3 4.6 4.1 4.3 2.9 0.5 9.4 10.0 13.4 9.0 9.4 14.4 11.8 12.8 13.1 -3.2 3.7 4.9 11.2 6.7 5.9 1.8 -3.7 -15.8 14.9 5.8 2.1 1.2 4.8 4.9 21 Services A656RL1 6.3 5.2 -2.8 4.2 -3.4 -0.1 -4.3 6.9 5.0 7.1 1.4 -2.2 5.9 5.3 8.1 25.1 7.6 1.1 11.8 3.4 4.8 6.5 -2.6 -2.7 2.7 5.3 3.0 5.2 8.7 10.9 -3.0 12.6 -0.6 3.3 2.1 12.7 4.5 8.6 6.2 3.7 -3.8 3.8 4.0 3.0 0.6 2.6 2.9 22 Government consumption expenditures and gross investment A822RL1 0.2 -2.0 -1.8 -0.5 -0.3 2.3 2.2 0.5 1.2 2.9 1.9 1.9 1.0 1.8 3.8 3.6 6.8 5.4 3.0 1.3 2.9 3.2 1.2 0.5 -0.8 0.1 0.5 1.0 1.9 2.1 3.4 1.9 3.8 4.4 2.2 1.6 0.6 1.5 1.6 2.8 3.2 0.1 -3.0 -1.9 -2.9 -0.9 1.8 23 Federal A823RL1 -2.4 -6.1 -6.4 -3.1 -3.6 0.7 0.5 0.2 2.2 2.5 2.3 4.4 4.5 3.7 6.5 3.3 7.9 5.9 3.8 -1.3 1.7 2.1 0.0 -1.5 -3.5 -3.5 -2.6 -1.2 -0.8 -0.9 2.0 0.3 3.9 7.2 6.8 4.5 1.7 2.5 1.7 6.8 5.7 4.4 -2.7 -1.9 -5.8 -2.5 0.0 24 National defense A824RL1 -4.1 -8.2 -10.2 -6.9 -5.1 -1.0 -1.0 -0.5 1.0 0.8 2.7 3.9 6.2 7.2 7.3 5.2 8.8 6.9 5.1 -0.2 -0.2 0.3 -1.0 -4.5 -5.1 -4.9 -4.0 -1.6 -2.7 -2.1 1.5 -0.9 3.5 7.0 8.5 6.0 2.0 2.0 2.5 7.5 5.4 3.2 -2.3 -3.4 -6.8 -4.1 -2.1 25 Nondefense A825RL1 3.9 1.0 5.6 7.2 0.2 4.6 3.9 1.6 4.7 6.0 1.7 5.4 1.0 -3.6 4.7 -1.4 5.7 3.1 0.2 -4.3 7.2 7.3 2.4 5.9 0.0 -0.8 0.0 -0.5 2.8 1.3 2.7 2.3 4.7 7.4 4.1 2.0 1.3 3.5 0.3 5.5 6.2 6.4 -3.4 0.9 -4.1 0.1 3.3 26 State and local A829RL1 3.5 2.9 3.1 2.2 2.8 3.7 3.6 0.8 0.4 3.3 1.5 -0.2 -2.0 0.1 1.3 3.8 5.7 5.0 2.2 3.9 4.0 4.1 2.2 2.1 1.2 2.8 2.7 2.4 3.6 3.8 4.2 2.8 3.7 2.9 -0.4 -0.1 0.0 0.9 1.5 0.3 1.6 -2.7 -3.3 -1.9 -0.8 0.2 2.9 Table 1.1.5. Gross Domestic Product [Billions of dollars] Annual data from 1969 To 2015 Bureau of Economic Analysis Data published August 26, 2016 File created 8/25/2016 1:55:36 PM Line 1969 1970 1971 1972 1973 1974 1975 1976 1977 1978 1979 1980 1981 1982 1983 1984 1985 1986 1987 1988 1989 1990 1991 1992 1993 1994 1995 1996 1997 1998 1999 2000 2001 2002 2003 2004 2005 2006 2007 2008 2009 2010 2011 2012 2013 2014 2015 1 Gross domestic product A191RC1 1019.9 1075.9 1167.8 1282.4 1428.5 1548.8 1688.9 1877.6 2086.0 2356.6 2632.1 2862.5 3211.0 3345.0 3638.1 4040.7 4346.7 4590.2 4870.2 5252.6 5657.7 5979.6 6174.0 6539.3 6878.7 7308.8 7664.1 8100.2 8608.5 9089.2 9660.6 10284.8 10621.8 10977.5 11510.7 12274.9 13093.7 13855.9 14477.6 14718.6 14418.7 14964.4 15517.9 16155.3 16691.5 17393.1 18036.6 2 Personal consumption expenditures DPCERC1 604.5 647.7 701.0 769.4 851.1 932.0 1032.8 1150.2 1276.7 1426.2 1589.5 1754.6 1937.5 2073.9 2286.5 2498.2 2722.7 2898.4 3092.1 3346.9 3592.8 3825.6 3960.2 4215.7 4471.0 4741.0 4984.2 5268.1 5560.7 5903.0 6307.0 6792.4 7103.1 7384.1 7765.5 8260.0 8794.1 9304.0 9750.5 10013.6 9847.0 10202.2 10689.3 11050.6 11361.2 11863.4 12283.7 3 Goods DGDSRC1 304.7 318.8 342.1 373.8 416.6 451.5 491.3 546.3 600.4 663.6 737.9 799.8 869.4 899.3 973.8 1063.7 1137.6 1195.6 1256.3 1337.3 1423.8 1491.3 1497.4 1563.3 1642.3 1746.6 1815.5 1917.7 2006.8 2108.7 2286.8 2452.9 2525.2 2598.6 2721.6 2900.3 3080.3 3235.8 3361.6 3375.7 3198.4 3362.8 3596.5 3739.1 3834.5 3970.5 4012.1 4 Durable goods DDURRC1 90.5 90.0 102.4 116.4 130.5 130.2 142.2 168.6 192.0 213.3 226.3 226.4 243.9 253.0 295.0 342.2 380.4 421.4 442.0 475.1 494.3 497.1 477.2 508.1 551.5 607.2 635.7 676.3 715.5 779.3 855.6 912.6 941.5 985.4 1017.5 1079.8 1127.2 1156.1 1184.6 1102.3 1023.3 1070.7 1125.3 1191.9 1241.7 1294.8 1355.2 5 Nondurable goods DNDGRC1 214.2 228.8 239.7 257.4 286.1 321.4 349.2 377.7 408.4 450.2 511.6 573.4 625.4 646.3 678.8 721.5 757.2 774.2 814.3 862.3 929.5 994.2 1020.3 1055.2 1090.8 1139.4 1179.8 1241.4 1291.2 1329.4 1431.2 1540.3 1583.7 1613.2 1704.0 1820.4 1953.1 2079.7 2176.9 2273.4 2175.1 2292.1 2471.1 2547.2 2592.8 2675.7 2656.9 6 Services DSERRC1 299.8 328.9 358.9 395.6 434.5 480.5 541.4 603.9 676.3 762.6 851.6 954.8 1068.1 1174.6 1312.7 1434.5 1585.1 1702.8 1835.8 2009.6 2169.0 2334.3 2462.7 2652.4 2828.7 2994.5 3168.6 3350.4 3554.0 3794.3 4020.3 4339.5 4577.9 4785.5 5044.0 5359.8 5713.8 6068.2 6388.9 6637.9 6648.5 6839.4 7092.8 7311.5 7526.7 7892.9 8271.6 7 Gross private domestic investment A006RC1 173.6 170.1 196.8 228.1 266.9 274.5 257.3 323.2 396.6 478.4 539.7 530.1 631.2 581.0 637.5 820.1 829.6 849.1 892.2 937.0 999.7 993.5 944.3 1013.0 1106.8 1256.5 1317.5 1432.1 1595.6 1735.3 1884.2 2033.8 1928.6 1925.0 2027.9 2276.7 2527.1 2680.6 2643.7 2424.8 1878.1 2100.8 2239.9 2511.7 2706.3 2886.5 3056.6 8 Fixed investment A007RC1 164.4 168.0 188.6 219.0 251.1 260.5 263.5 306.1 374.3 452.6 521.7 536.4 601.4 595.9 643.3 754.7 807.8 842.6 865.0 918.5 972.0 978.9 944.7 996.7 1086.0 1192.7 1286.3 1401.3 1524.7 1671.6 1823.4 1979.2 1966.9 1906.5 2008.7 2212.8 2467.5 2613.7 2609.3 2456.8 2025.7 2039.3 2198.1 2449.9 2613.9 2821.0 2963.2 9 Nonresidential A008RC1 120.0 124.6 130.4 146.6 172.7 191.1 196.8 219.3 259.1 314.6 373.8 406.9 472.9 485.1 482.2 564.3 607.7 607.8 615.2 662.3 716.0 739.2 723.6 741.9 799.2 868.9 962.2 1043.2 1149.1 1252.8 1361.6 1493.8 1453.9 1348.9 1371.7 1463.1 1611.5 1776.3 1920.6 1941.0 1633.4 1658.2 1812.1 2007.7 2094.4 2251.0 2311.3 10 Structures B009RC1 37.7 40.3 42.7 47.2 55.0 61.2 61.4 65.9 74.6 93.6 117.7 136.2 167.3 177.6 154.3 177.4 194.5 176.5 174.2 182.8 193.7 202.9 183.6 172.6 177.2 186.8 207.3 224.6 250.3 275.1 283.9 318.1 329.7 282.9 281.8 301.8 345.6 415.6 496.9 552.4 438.2 362.0 381.6 448.0 463.6 530.7 507.3 11 Equipment Y033RC1 65.2 66.4 69.1 78.9 95.1 104.3 107.6 121.2 148.7 180.6 208.1 216.4 240.9 234.9 246.5 291.9 307.9 317.7 320.9 346.8 372.2 371.9 360.8 381.7 425.1 476.4 528.1 565.3 610.9 660.0 713.6 766.1 711.5 659.6 669.0 719.2 790.7 856.1 885.8 825.1 644.3 731.8 838.2 937.9 982.8 1040.7 1086.1 12 Intellectual property products Y001RC1 17.2 17.9 18.7 20.6 22.7 25.5 27.8 32.2 35.8 40.4 48.1 54.4 64.8 72.7 81.3 95.1 105.3 113.5 120.1 132.7 150.1 164.4 179.1 187.7 196.9 205.7 226.8 253.3 288.0 317.7 364.0 409.5 412.6 406.4 420.9 442.1 475.1 504.6 537.9 563.4 550.9 564.3 592.2 621.7 647.9 679.6 717.9 13 Residential A011RC1 44.4 43.4 58.2 72.4 78.3 69.5 66.7 86.8 115.2 138.0 147.8 129.5 128.5 110.8 161.1 190.4 200.1 234.8 249.8 256.2 256.0 239.7 221.2 254.7 286.8 323.8 324.1 358.1 375.6 418.8 461.8 485.4 513.0 557.6 636.9 749.7 856.1 837.4 688.7 515.9 392.2 381.1 386.0 442.2 519.5 570.1 651.9 14 Change in private inventories A014RC1 9.2 2.0 8.3 9.1 15.9 14.0 -6.3 17.1 22.3 25.8 18.0 -6.3 29.8 -14.9 -5.8 65.4 21.8 6.6 27.1 18.5 27.7 14.5 -0.4 16.3 20.8 63.8 31.2 30.8 70.9 63.7 60.8 54.5 -38.3 18.5 19.3 63.9 59.6 67.0 34.5 -32.0 -147.6 61.5 41.8 61.8 92.4 65.4 93.4 15 Net exports of goods and services A019RC1 1.4 4.0 0.6 -3.4 4.1 -0.8 16.0 -1.6 -23.1 -25.4 -22.5 -13.1 -12.5 -20.0 -51.6 -102.7 -114.0 -131.9 -144.8 -109.4 -86.7 -77.9 -28.6 -34.7 -65.2 -92.5 -89.8 -96.4 -102.0 -162.7 -256.6 -375.8 -368.7 -426.5 -503.7 -619.2 -721.2 -770.9 -718.5 -723.1 -395.4 -512.7 -580.0 -565.7 -492.0 -508.8 -522.0 16 Exports B020RC1 51.9 59.7 63.0 70.8 95.3 126.7 138.7 149.5 159.4 186.9 230.1 280.8 305.2 283.2 277.0 302.4 303.2 321.0 363.9 444.6 504.3 551.9 594.9 633.1 654.8 720.9 812.8 867.6 953.8 953.0 992.0 1096.8 1026.7 1002.5 1040.3 1181.5 1308.9 1476.3 1664.6 1841.9 1587.7 1852.3 2106.4 2198.2 2276.6 2375.3 2264.3 17 Goods A253RC1 38.7 45.0 46.2 52.6 75.8 103.5 112.5 121.5 128.4 149.9 187.3 230.4 245.2 222.6 214.0 231.3 227.5 231.4 265.6 332.1 374.8 403.3 430.1 455.3 467.7 518.4 592.4 628.8 699.9 692.6 711.7 797.3 743.8 713.2 741.4 834.4 926.6 1049.6 1166.4 1298.8 1065.1 1279.6 1466.9 1526.0 1562.7 1618.1 1498.4 18 Services A646RC1 13.2 14.7 16.8 18.3 19.5 23.2 26.2 28.0 30.9 37.0 42.9 50.3 60.0 60.7 62.9 71.1 75.7 89.6 98.4 112.5 129.5 148.6 164.8 177.7 187.1 202.6 220.4 238.8 253.9 260.4 280.3 299.6 282.9 289.3 298.9 347.1 382.3 426.7 498.2 543.1 522.6 572.7 639.5 672.2 713.9 757.2 765.9 19 Imports B021RC1 50.5 55.8 62.3 74.2 91.2 127.5 122.7 151.1 182.4 212.3 252.7 293.8 317.8 303.2 328.6 405.1 417.2 452.9 508.7 554.0 591.0 629.7 623.5 667.8 720.0 813.4 902.6 964.0 1055.8 1115.7 1248.6 1472.6 1395.4 1429.0 1543.9 1800.7 2030.1 2247.3 2383.2 2565.0 1983.2 2365.0 2686.4 2763.8 2768.6 2884.1 2786.3 20 Goods A255RC1 36.8 40.9 46.6 56.9 71.8 104.5 99.0 124.6 152.6 177.4 212.8 248.6 267.8 250.5 272.7 336.3 343.3 370.0 414.8 452.1 484.8 508.1 500.7 544.9 592.8 676.8 757.4 807.4 885.7 930.8 1051.2 1251.5 1176.7 1199.3 1296.2 1511.6 1719.4 1899.7 2003.8 2149.4 1590.3 1949.8 2244.7 2305.8 2301.5 2396.5 2291.1 21 Services B656RC1 13.7 14.9 15.8 17.3 19.3 22.9 23.7 26.5 29.8 34.8 39.9 45.3 49.9 52.6 56.0 68.8 73.9 82.9 93.9 101.9 106.2 121.7 122.8 122.9 127.2 136.6 145.1 156.5 170.1 184.9 197.4 221.2 218.7 229.6 247.7 289.1 310.7 347.6 379.4 415.6 392.9 415.2 441.6 458.0 467.1 487.6 495.2 22 Government consumption expenditures and gross investment A822RC1 240.4 254.2 269.3 288.2 306.4 343.1 382.9 405.8 435.8 477.4 525.5 590.8 654.7 710.0 765.7 825.2 908.4 974.5 1030.8 1078.2 1151.9 1238.4 1298.2 1345.4 1366.1 1403.7 1452.2 1496.4 1554.2 1613.5 1726.0 1834.4 1958.8 2094.9 2220.8 2357.4 2493.7 2642.2 2801.9 3003.2 3089.1 3174.0 3168.7 3158.6 3116.1 3152.1 3218.3 23 Federal A823RC1 131.1 132.7 134.4 141.5 145.6 158.1 172.8 183.8 198.8 216.7 237.7 272.4 311.7 345.6 380.2 407.6 449.3 478.4 500.2 508.8 531.4 560.0 580.7 586.6 578.4 572.7 575.4 578.2 582.4 584.1 610.4 632.4 669.2 740.6 824.8 892.4 946.3 1002.0 1049.8 1155.6 1217.7 1303.9 1303.5 1292.5 1229.5 1218.9 1225.0 24 National defense A824RC1 102.1 100.7 98.0 100.6 102.0 109.2 117.0 123.8 132.8 143.0 157.8 181.0 211.2 242.8 269.3 294.7 326.0 349.2 369.9 379.6 388.6 402.8 412.0 404.7 390.1 380.3 376.0 376.5 371.4 367.7 382.7 391.7 412.7 456.8 519.9 570.2 608.3 642.4 678.7 754.1 788.3 832.8 836.9 817.8 767.0 746.0 732.0 25 Nondefense A825RC1 29.1 32.0 36.4 40.9 43.5 48.9 55.8 60.0 66.0 73.7 79.9 91.4 100.5 102.8 110.8 113.0 123.3 129.2 130.3 129.2 142.7 157.3 168.8 181.9 188.3 192.4 199.3 201.7 211.0 216.4 227.7 240.7 256.5 283.8 304.9 322.1 338.1 359.6 371.0 401.5 429.4 471.1 466.5 474.7 462.5 472.9 493.0 26 State and local A829RC1 109.3 121.4 134.9 146.7 160.8 185.0 210.2 222.1 237.0 260.7 287.8 318.5 343.0 364.4 385.6 417.5 459.2 496.1 530.5 569.3 620.5 678.3 717.4 758.8 787.7 831.1 876.8 918.2 971.8 1029.4 1115.6 1202.0 1289.5 1354.3 1396.0 1465.0 1547.4 1640.2 1752.2 1847.6 1871.4 1870.2 1865.3 1866.1 1886.6 1933.2 1993.3Assignment Specifications The lines of interest in the file GDP. txt are the 9h line which has the annual change in GDP and the 44th line which has the value of GDP for each year. The data starts in column 76 and each of the 47 data items spans 12 columns (there are 47 years inclusively from 1969 through 2015). These numbers are important because you can use string slicing to extract them. For example, the first data item in a line can be extracted using the slice line [76:76+12] Your task is to find the minimum and maximum change in GDP for the years 1969 through 2015 and to find the GDP value for those two years. See the sample output below. Your program will prompt for an input file and then display the output. You must use specific functions as described below and you are not allowed to use collections such as lists tuples and dictionaries. Mirmir tests: I can provide any file with the same format as the provided GDP.txt-the number of rows will be the same (so you can select lines 9 and 44), but the number of columns may be different (i.e. different years) Assignment Notes Divide-and-conquer is an important problem solving technique. In fact, inside of every challenging problem is a simpler problem trying to get out. Your challenge is to find those simpler problems and divide the problem into smaller pieces that you can conquer. Functions can assist in this approach. We provide skeleton code on Mirmir that has all the function skeletons for you to fill in Hint: build the following functions one at a time and test each one before moving on to the next. 1. The open file function takes no arguments and returns a file pointer. It repeatedly prompts for file names until a file successfully opens. Use the try-except construct checking for the FileNotFoundError exception. You do not need to check that the filename is correct-simply check that the file opened. The simplest version of this function has no error checking so the body of the function is simply fp open ("GDP txt") return fp Hint: Start with that as your function body and add the try-except error checking later
Step by Step Solution
There are 3 Steps involved in it
Step: 1

Get Instant Access to Expert-Tailored Solutions
See step-by-step solutions with expert insights and AI powered tools for academic success
Step: 2

Step: 3
Ace Your Homework with AI
Get the answers you need in no time with our AI-driven, step-by-step assistance
Get Started
Machine Learning And Knowledge Discovery In Databases European Conference Ecml Pkdd 2015 Porto Portugal September 7 11 2015 Proceedings Part 2 Lnai 9285
Authors: Annalisa Appice ,Pedro Pereira Rodrigues ,Vitor Santos Costa ,Joao Gama ,Alipio Jorge ,Carlos Soares
1st Edition
3319235249, 978-3319235240