Answered step by step
Verified Expert Solution
Link Copied!

Question

1 Approved Answer

dfffdkkfkfk Price P1 D Q1 * Quantity of toothpaste Figure 2 (a) Using supply and demand diagram in figure 2, draw and explain the effects

dfffdkkfkfk
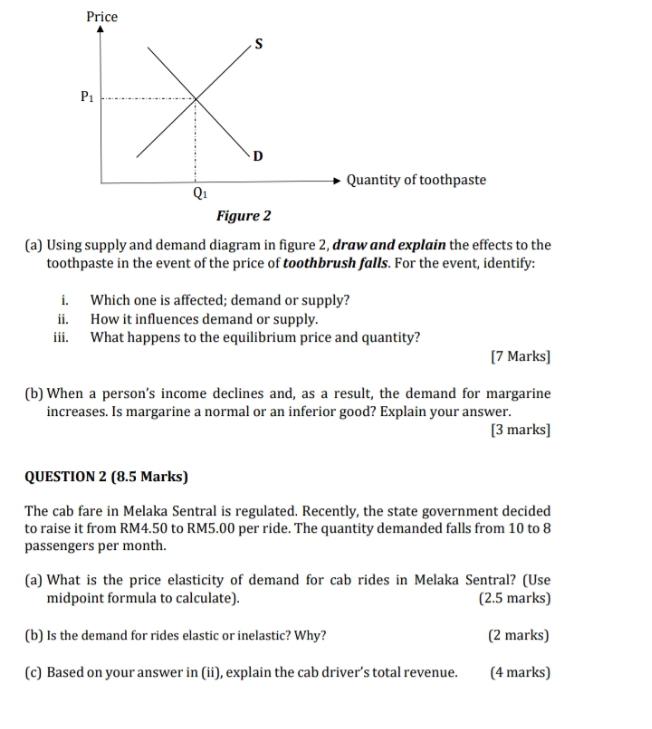
image text in transcribed
Price P1 D Q1 * Quantity of toothpaste Figure 2 (a) Using supply and demand diagram in figure 2, draw and explain the effects to the toothpaste in the event of the price of toothbrush falls. For the event, identify: i. Which one is affected; demand or supply? ii. How it influences demand or supply. iii. What happens to the equilibrium price and quantity? [7 Marks] (b) When a person's income declines and, as a result, the demand for margarine increases. Is margarine a normal or an inferior good? Explain your answer. [3 marks] QUESTION 2 (8.5 Marks) The cab fare in Melaka Sentral is regulated. Recently, the state government decided to raise it from RM4.50 to RM5.00 per ride. The quantity demanded falls from 10 to 8 passengers per month. (a) What is the price elasticity of demand for cab rides in Melaka Sentral? (Use midpoint formula to calculate). (2.5 marks) (b) Is the demand for rides elastic or inelastic? Why? (2 marks) (c) Based on your answer in (ii), explain the cab driver's total revenue. (4 marks)

Step by Step Solution

There are 3 Steps involved in it

Step: 1

blur-text-image

Get Instant Access to Expert-Tailored Solutions

See step-by-step solutions with expert insights and AI powered tools for academic success

Step: 2

blur-text-image

Step: 3

blur-text-image

Ace Your Homework with AI

Get the answers you need in no time with our AI-driven, step-by-step assistance

Get Started

Recommended Textbook for

Econometric Analysis

Authors: William H. Greene

5th Edition

130661899, 978-0130661890

More Books

Students also viewed these Economics questions