

Answered step by step
Verified Expert Solution
Question
1 Approved Answer
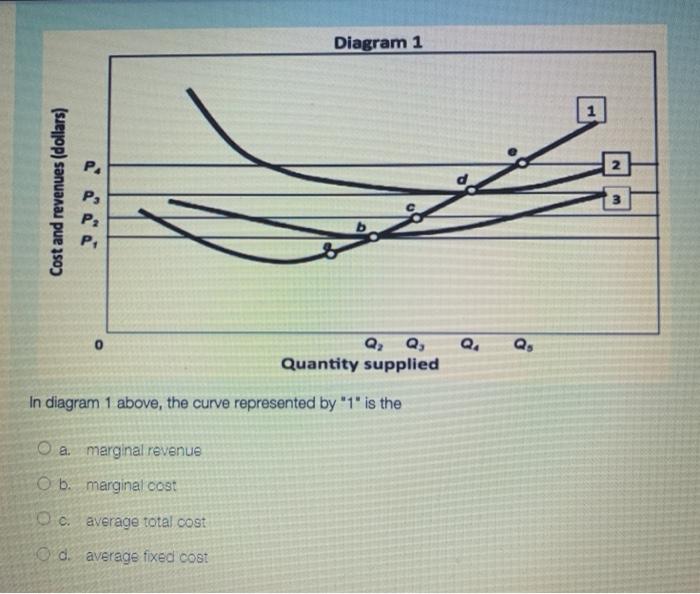
Diagram 1 P Cost and revenues (dollars) P P; P Q. Q, Q, Quantity supplied In diagram 1 above, the curve represented by 1 is

Step by Step Solution
There are 3 Steps involved in it
Step: 1

Get Instant Access to Expert-Tailored Solutions
See step-by-step solutions with expert insights and AI powered tools for academic success
Step: 2

Step: 3
Ace Your Homework with AI
Get the answers you need in no time with our AI-driven, step-by-step assistance
Get Started
Financial Accounting
Authors: Robert Kemp, Jeffrey Waybright
2nd edition
978-0132771801, 9780132771580, 132771802, 132771586, 978-0133052152