

Answered step by step
Verified Expert Solution
Question
1 Approved Answer
Diagram interpretation 200 Spread in Returns for Major Asset Classes, 1962-2018 -60 S&P 500 Inflation Treasury bills Corporate bonds Treasury bonds Small stocks
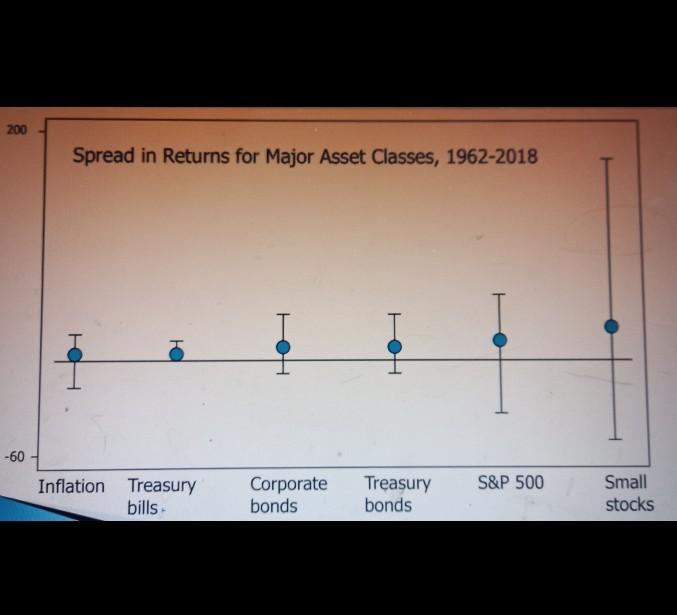
Diagram interpretation
200 Spread in Returns for Major Asset Classes, 1962-2018 -60 S&P 500 Inflation Treasury bills Corporate bonds Treasury bonds Small stocksStep by Step Solution
There are 3 Steps involved in it
Step: 1

Get Instant Access to Expert-Tailored Solutions
See step-by-step solutions with expert insights and AI powered tools for academic success
Step: 2

Step: 3
Ace Your Homework with AI
Get the answers you need in no time with our AI-driven, step-by-step assistance
Get Started
Small Fund Management
Authors: K. K.
1st Edition
979-8866391837