Answered step by step
Verified Expert Solution
Question
1 Approved Answer
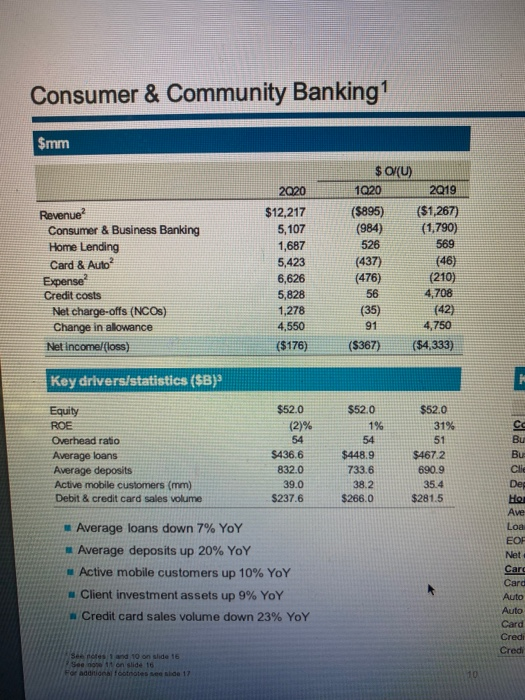
did the firm make the most revenue in card & auto? also for Key drivers & statistics did the firm make the most money in
did the firm make the most revenue in card & auto? also for Key drivers & statistics did the firm make the most money in Average deposits? what are average deposits? 

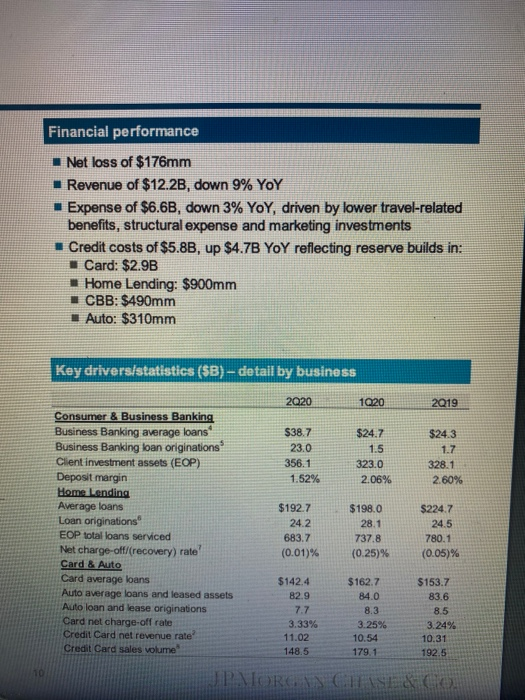
Consumer & Community Banking $mm Revenue? Consumer & Business Banking Home Lending Card & Auto? Expense? Credit costs Nel charge-offs (NCOS) Change in allowance Net Income (loss) 2020 $12,217 5,107 1,687 5,423 6,626 5,828 1,278 4,550 ($176) $ OR(U) 1920 2019 ($895) ($1,267) (984) (1.790) 526 569 (437) (46) (476) (210) 56 4,708 (35) (42) 91 4,750 ($367) ($4,333) Key drivers/statistics ($B} Equity ROE Overhead ratio Average loans Average deposits Active mobile customers (mm) Debit & credit card sales volume $52.0 (2)% 54 $436,6 832.0 39.0 $237.6 $52.0 1% 54 $448.9 733.6 38.2 $266.0 $52.0 31% 51 $4672 690.9 35.4 $281.5 ce Bu Bu Clic Average loans down 7% YoY Average deposits up 20% YoY Active mobile customers up 10% YoY Client investment assets up 9% YoY Credit card sales volume down 23% YoY Deg Ave Loa EOF Net Card Card Auto Auto Card Credi Credi See notes 1 and 10 on slide 16 Seen on slide 16 For addition toontes e de 17 10 Financial performance Net loss of $176mm Revenue of $12.2B, down 9% YoY Expense of $6.6B, down 3% YOY, driven by lower travel-related benefits, structural expense and marketing investments Credit costs of $5.8B, up $4.7B YOY reflecting reserve builds in: Card: $2.9B Home Lending: $900mm 1 CBB: $490mm Auto: $310mm Key drivers/statistics (SB) - detail by business 2020 1920 2019 $38.7 23.0 356.1 1.52% $24.7 1.5 323.0 2.06% $24.3 1.7 328.1 2.60% Consumer & Business Banking Business Banking average loans Business Banking loan originations Client investment assets (EOP) Deposit margin Home Lending Average loans Loan originations EOP total loans serviced Net charge-off/(recovery) rate' Card & Auto Card average loans Auto average loans and leased assets Auto loan and lease originations Card net charge-off rate Credit Card net revenue rate Credit Card sales volume $192.7 24.2 683.7 (0.01)% $198.0 28.1 737.8 (0.25)% $2247 24.5 780.1 (0.05)% $142.4 82.9 7.7 3.33% 11.02 148.5 $162.7 84.0 8.3 3.25% 10.54 179.1 $153.7 83.6 8.5 3.24% 10.31 192.5 OP MORGN CHE & CO 

Step by Step Solution
There are 3 Steps involved in it
Step: 1

Get Instant Access to Expert-Tailored Solutions
See step-by-step solutions with expert insights and AI powered tools for academic success
Step: 2

Step: 3

Ace Your Homework with AI
Get the answers you need in no time with our AI-driven, step-by-step assistance
Get Started


