

Question
Direction: Analyze the given data and create a line graph in excel and show step-by-step how to create a line graph base on the given
Direction: Analyze the given data and create a line graph in excel and show step-by-step how to create a line graph base on the given data to reflect the trends on population. The line graph must have the following elements: title, legend, and labels.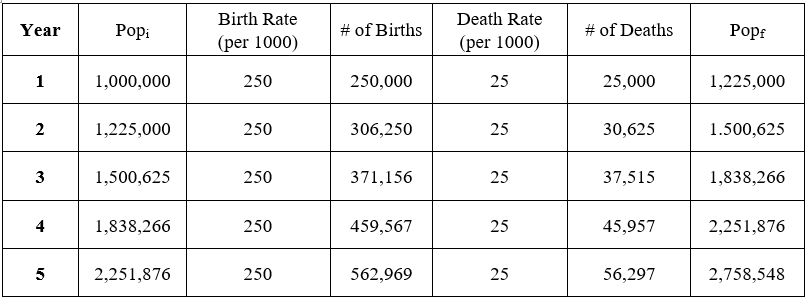
Step by Step Solution
There are 3 Steps involved in it
Step: 1

Get Instant Access to Expert-Tailored Solutions
See step-by-step solutions with expert insights and AI powered tools for academic success
Step: 2

Step: 3
Ace Your Homework with AI
Get the answers you need in no time with our AI-driven, step-by-step assistance
Get Started
Audit Of The Management Of Federal Prison Industries And Efforts To Create Work Opportunities For Federal Inmates
Authors: U.S. Department Of Justice
1st Edition
1500770442, 978-1500770440