

Question
Directions: Click on the graph to the right and select Time Series to graph the U.S.?chain-weighted Real Gross Domestic Product?(RGDP) and its rate of growth.
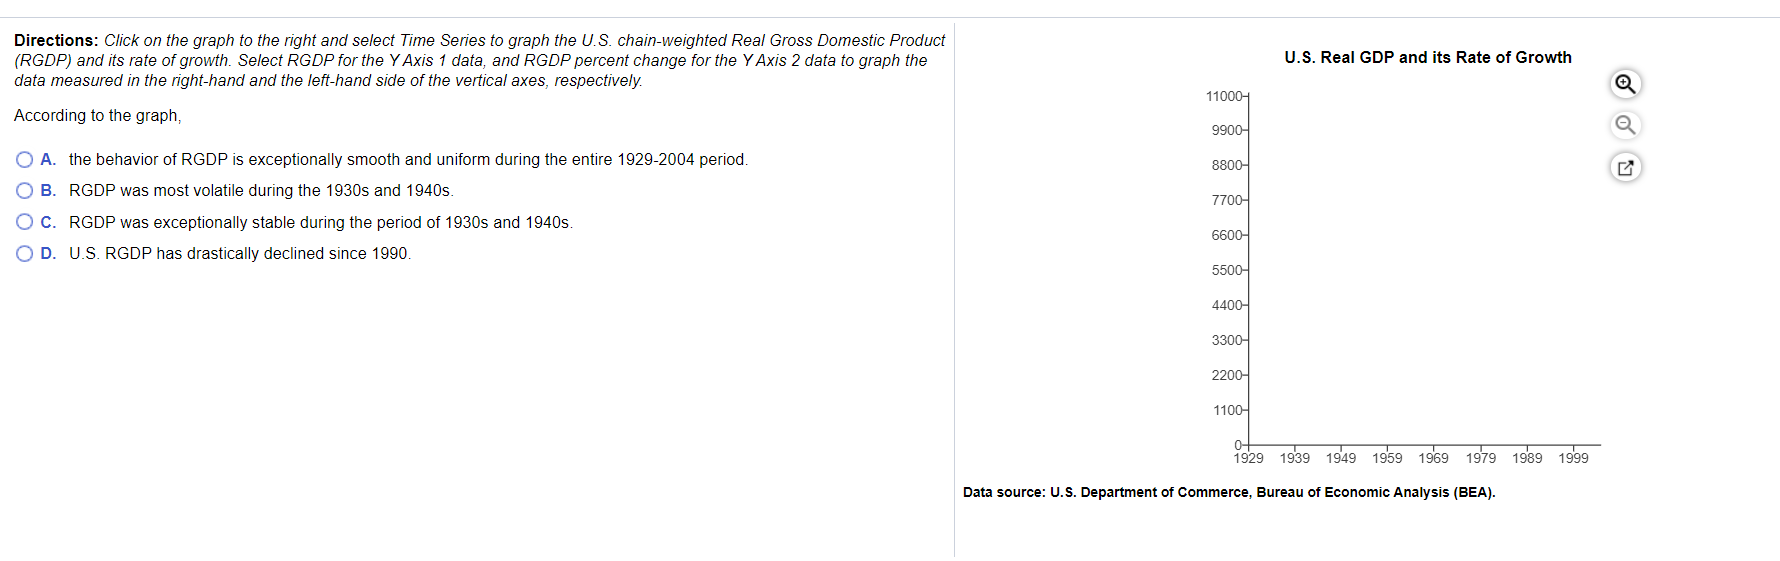
Directions: Click on the graph to the right and select Time Series to graph the U.S.?chain-weighted Real Gross Domestic Product?(RGDP) and its rate of growth. Select RGDP for the Y Axis 1?data, and RGDP percent change for the Y Axis 2 data to graph the data measured in the?right-hand and the?left-hand side of the vertical?axes, respectively.??
According to the?graph,
A.
the behavior of RGDP is exceptionally smooth and uniform during the entire?1929-2004 period.
B.
RGDP was most volatile during the 1930s and 1940s.
C.
RGDP was exceptionally stable during the period of 1930s and 1940s.
D.
U.S. RGDP has drastically declined since 1990.
Step by Step Solution
There are 3 Steps involved in it
Step: 1

Get Instant Access to Expert-Tailored Solutions
See step-by-step solutions with expert insights and AI powered tools for academic success
Step: 2

Step: 3
Ace Your Homework with AI
Get the answers you need in no time with our AI-driven, step-by-step assistance
Get Started
Exploring Economics
Authors: Robert L Sexton
5th Edition
978-1439040249, 1439040249