Directions:
- Excel file work: You must use cell referencing for the input data. You must use Excel for all calculations. You will be graded on accuracy of your calculations, Excel use in calculations, formatting, and appearance. Be sure to remove grid lines.
- Financial Statements: Use the data sheet tab to create the following three statements.
- Income Statement for Year ended 2018. Proper form excludes row numbers and all text is in black. See rubric for details. Check figure for Earnings Available to Common = $16,590
- Statement of Retained Earnings for Year ended
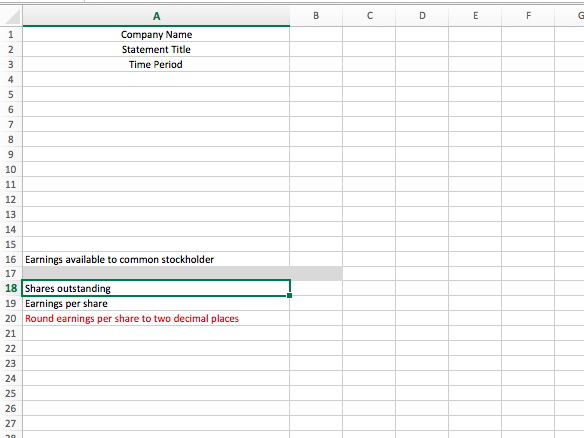
 2018.
2018. 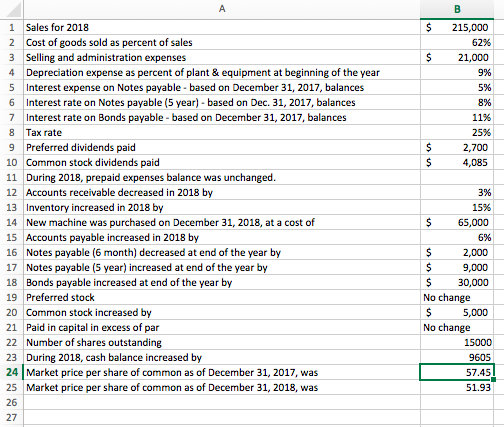
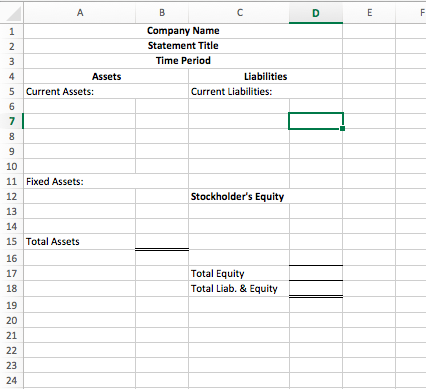
- Balance Sheet as of December 31, 2018. *See Table 2.4 in text for example
Check figure for Total Assets = $384,985
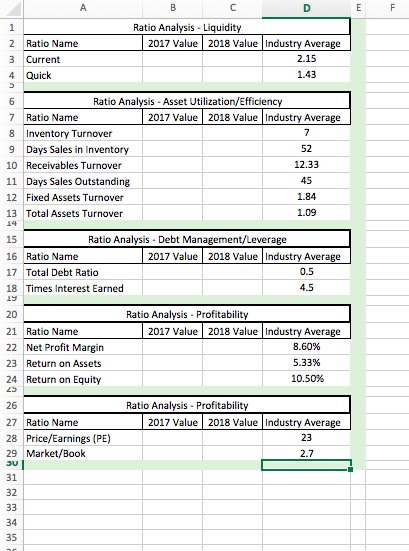
- Financial Ratios: Use the 2017 and 2018 financial statements to calculate the ratios specified on the Ratio Analysis tab.
Company Name Statement Title Time Period 16 Earnings available to common stockholder 18 Shares outstanding 19 Earnings per share 20 Round earnings per share to two decimal places Company Name Statement Title Time Period Liabilities Current Liabilities: Assets Current Assets: 11 Fixed Assets: Stockholder's Equity Total Assets Total Equity Total Liab. & Equity Ratio Name Current Quick Ratio Analysis - Liquidity 2017 Value 2018 Value Industry Average 2.15 1.43 Ratio Analysis - Asset Utilization/Efficiency 7 Ratio Name 2017 Value 2018 Value Industry Average 8 Inventory Turnover 9 Days Sales in Inventory 52 10 Receivables Turnover 12.33 11 Days Sales Outstanding 45 12 Fixed Assets Turnover 1.84 13 Total Assets Turnover 1.09 Ratio Analysis - Debt Management/Leverage 16 Ratio Name 2017 Value 2018 Value Industry Average 17 Total Debt Ratio Times Interest Earned 21 Ratio Name 22 Net Profit Margin 23 Return on Assets 24 Return on Equity Ratio Analysis - Profitability 2017 Value 2018 Value Industry Average 8.60% 5.33% 10.50% 27 Ratio Name 28 Price/Earnings (PE) 29 Market/Book JU Ratio Analysis - Profitability 2017 Value 2018 Value Industry Average 23 $ 215,000 62% $ 21,000 9% 5% 8% 11% 25% 2,700 4,085 1 Sales for 2018 2 Cost of goods sold as percent of sales 3 Selling and administration expenses 4 Depreciation expense as percent of plant & equipment at beginning of the year 5 Interest expense on Notes payable - based on December 31, 2017, balances 6 Interest rate on Notes payable (5 year) - based on Dec 31, 2017, balances 7 Interest rate on Bonds payable - based on December 31, 2017, balances 8 Tax rate 9 Preferred dividends paid 10 Common stock dividends paid 11 During 2018, prepaid expenses balance was unchanged. 12 Accounts receivable decreased in 2018 by 13 Inventory increased in 2018 by 14 New machine was purchased on December 31, 2018, at a cost of 15 Accounts payable increased in 2018 by 16 Notes payable (6 month) decreased at end of the year by 17 Notes payable (5 year) increased at end of the year by 18 Bonds payable increased at end of the year by 19 Preferred stock 20 Common stock increased by 21 Paid in capital in excess of par 22 Number of shares outstanding 23 During 2018, cash balance increased by 24 Market price per share of common as of December 31, 2017, was 25 Market price per share of common as of December 31, 2018, was 3% 15% $ 65,000 6% $ 2,000 $ 9,000 $ 30,000 No change $ 5,000 No change 15000 9605 1 57.45! 51.93 Company Name Statement Title Time Period 16 Earnings available to common stockholder 18 Shares outstanding 19 Earnings per share 20 Round earnings per share to two decimal places Company Name Statement Title Time Period Liabilities Current Liabilities: Assets Current Assets: 11 Fixed Assets: Stockholder's Equity Total Assets Total Equity Total Liab. & Equity Ratio Name Current Quick Ratio Analysis - Liquidity 2017 Value 2018 Value Industry Average 2.15 1.43 Ratio Analysis - Asset Utilization/Efficiency 7 Ratio Name 2017 Value 2018 Value Industry Average 8 Inventory Turnover 9 Days Sales in Inventory 52 10 Receivables Turnover 12.33 11 Days Sales Outstanding 45 12 Fixed Assets Turnover 1.84 13 Total Assets Turnover 1.09 Ratio Analysis - Debt Management/Leverage 16 Ratio Name 2017 Value 2018 Value Industry Average 17 Total Debt Ratio Times Interest Earned 21 Ratio Name 22 Net Profit Margin 23 Return on Assets 24 Return on Equity Ratio Analysis - Profitability 2017 Value 2018 Value Industry Average 8.60% 5.33% 10.50% 27 Ratio Name 28 Price/Earnings (PE) 29 Market/Book JU Ratio Analysis - Profitability 2017 Value 2018 Value Industry Average 23 $ 215,000 62% $ 21,000 9% 5% 8% 11% 25% 2,700 4,085 1 Sales for 2018 2 Cost of goods sold as percent of sales 3 Selling and administration expenses 4 Depreciation expense as percent of plant & equipment at beginning of the year 5 Interest expense on Notes payable - based on December 31, 2017, balances 6 Interest rate on Notes payable (5 year) - based on Dec 31, 2017, balances 7 Interest rate on Bonds payable - based on December 31, 2017, balances 8 Tax rate 9 Preferred dividends paid 10 Common stock dividends paid 11 During 2018, prepaid expenses balance was unchanged. 12 Accounts receivable decreased in 2018 by 13 Inventory increased in 2018 by 14 New machine was purchased on December 31, 2018, at a cost of 15 Accounts payable increased in 2018 by 16 Notes payable (6 month) decreased at end of the year by 17 Notes payable (5 year) increased at end of the year by 18 Bonds payable increased at end of the year by 19 Preferred stock 20 Common stock increased by 21 Paid in capital in excess of par 22 Number of shares outstanding 23 During 2018, cash balance increased by 24 Market price per share of common as of December 31, 2017, was 25 Market price per share of common as of December 31, 2018, was 3% 15% $ 65,000 6% $ 2,000 $ 9,000 $ 30,000 No change $ 5,000 No change 15000 9605 1 57.45! 51.93