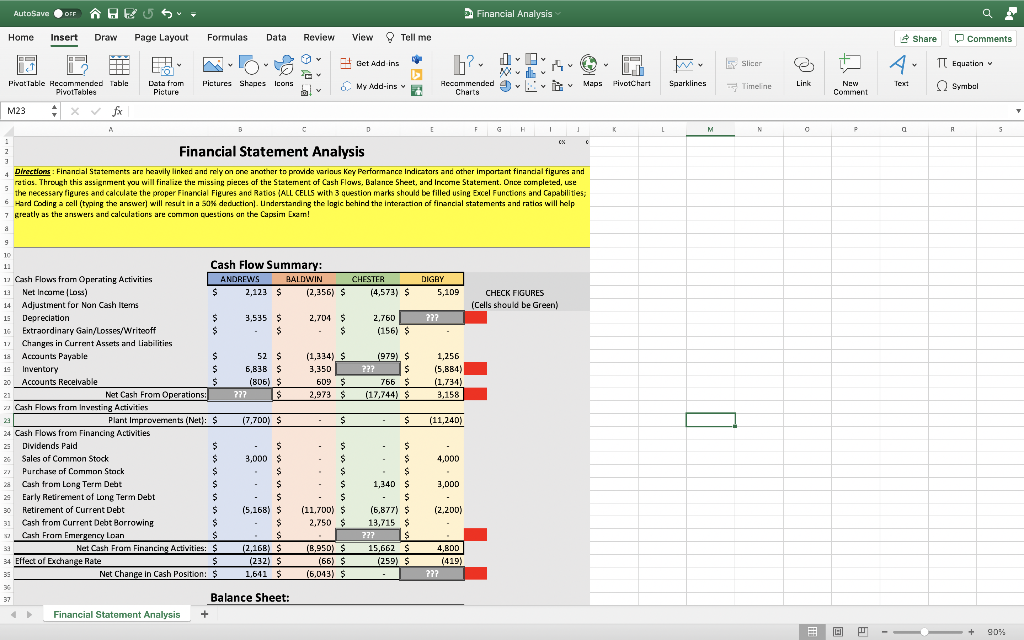
Directions: Financial Statements are heavily linked and rely on one another to provide various Key Performance Indicators and other important financial figures and ratios. Through this assignment you will finalize the missing pieces of the Statement of Cash Flows, Balance Sheet, and Income Statement. Once completed, use the necessary figures and calculate the proper Financial Figures and Ratios (ALL CELLS with 3 question marks should be filled using Excel Functions and Capabilities; Hard Coding a cell (typing the answer) will result in a 50% deduction). Understanding the logic behind the interaction of financial statements and ratios will help greatly as the answers and calculations are common questions on the Capsim Exam!
AutoSave OFF OFF A5 HEU 5 Financial Analysis Home Insert Draw Page Layout Formulas Data Review View Tell me Share Comments Y y Get Add ins 6? ti V Slicer TT Equation v riv 0.1 Hecammended Maps Pivotchart Charts Pictures Shapes icons Sparklines Data from Picture Text My Add-ins Link V buv Timeline NEW Comment Symbol V PivatTable Hecommended Table Pivot Tables M23 + x fx T A B E G 1 x M N N a R 5 CX 0 1 2 3 4 Financial Statement Analysis Directions: Financial Statements are heavily linked and rely on one another to provide various Key Performance Indicators and other important financial figures and ratios. Through this assignment you will finalize the missing pieces of the Statement of Cash Flows, Balance Sheet, and Income Statement. Once completed, use 5 the necessary figures and calculate the proper Financial Figures and Ratios (ALL CELLS with 3 question marks should be filled using Excel Functions and Capabilities; 6 Hard coding a cell (typing the answer will result in a 50% deduction). Understanding the logic behind the interaction of financial statements and ratios will help 7 greatly as the answers and calculations are common Questions on the Capsim Encarn! a CHESTER (4,573) $ DIGRY 5,109 CHECK FIGURES (Cells should be Green) ??? 2.760 (156) $ 12 (979) $ ??? $ 766 $ 117,744) $ 1,256 (5,884) (1.734) 3,158 $ (11,240) 9 10 11 Cash Flow Summary: 12 Cash Flows from Operating Activities ANDREWS BALDWIN 12 Net Income Los) $ 2,123 5 (2,356) $ 14 Adjustment for Non Cash Items 15 Depreciation $ 3,535 $ 2.7045 16 Extraordinary Gain/Losses/Writeoff $ $ $ Changes in Current Assets and liabilities 18 Accounts Payable $ 52 $ (1,334) $ 19 Inventory $ 6,838 $ 3.350 20 Accounts Receivable $ (806) $ 609 $ 21 Net Cash From Operations ??? $ 2,973 $ z Cash Flows fram Investing Activities Plant Improvements (Net): $ (7,700) $ - $ $ 24 Cash Flows from Financing Activities 25 Dividends Paid $ $ - $ 26 Sales of Common Stock $ 3,000 $ - $ 7) Purchase of Common Stock $ $ s Cash from Long Term Debt $ $ . $ Early Retirement of Long Term Debt $ $ $ 30 Retirement of Current Debt $ (5.168) $ (11.700) $ 31 Cash from Current Debt Borrowing S $ 2,750 $ Cash Framn Emergency Loan $ $ 32 Net Cash From Financing Activities: $ (2,168) $ (6,950 $ 34 Effect of Exchange Rate $ $ (232) $ (66) S 33 Net Change in Cash Position: 1.641 $ (6,013) $ 30 37 Balance Sheet: Financial Statement Analysis + S 4,000 3,000 . $ - $ $ 1,340 $ $ (6,877) $ 13,715 $ ??? $ $ 15,662 $ (259) $ (2,200) 4,800 ( (419) ??? + 90% AutoSave OFF OFF A5 A Financial Analysis Home Insert Draw Page Layout Formulas Data Review View Tell me Share Comments v Y y Get Add ins b? ti V V TT Equation Slicer 0.1 Maps PivotChart v Pictures Shapes Icons Sparklines Text PivatTable Hecommended Table Pivot Tables Data from Picture 6 My Add-ins Link Hecommended to Charts V al Timeline NEW Comment Symbol M23 X fx T A B E G H 1 J K M N 0 0 P 0 R R S wwwwww 39 Net Change in Cash Position: $ 1,511 5 16,043) $ ??? 36 37 39 Cash 40 Accounts Receivable t) Inventory Total Current Assets Plant and Equipment 44 Accumulated Deprecation Total Fixed Assets of Total Assets 47 Accounts Payable Current Debt 29 Long Term Debt 50 Total Liabilities Common Stock Retained Earnings 53 54 Total Labilities & Owners Equity: 55 Balance Sheet: ANDREWS BALDWIN $ 1,641 5 9,779 $ $ 5,352 $ 3,350 $ ??? S $ 9,419 $ $ 13,425 ??? S $ $ 53,020 S 40,560 $ $ $ (21,259 $ (19,8081 $ $ 31,761 ??? $ S ??? ??? $ 3,000 $ 2,233 $ $ $ 2,750 $ $ $ 11,000 $ 17,000 $ S 14.000 $ 21,983 $ ??? S $ 7,808 $ $ 21,859 $ 13,519 $ 31,106 ??? $ $ 45,186 $ 43,310 $ CHESTER DIGBY $ 7,755 4,707 $ 9,196 33,240 $ 15,098 37,947 $ 32,049 41 400 $ 66,160 (19,044) $ 122.971) 22,356 $ 43,189 ??? ??? 4,688 $ 6,444 21,200 $ 21,840 ??? 47,728 $ 29.444 6,808 $ 15,808 ??? S 29,487 12,575 ??? 60,303 ??? Total Equity Sales 59 Variable Cost (Labor, Material, Carry, Shipl 60 Depreciation 62 SG&A (R&D/Promo/Sales/Admin) Other Fers/Writeoffs EBIT 64 Interest (Short Term/Long Term) Taxes GE Profit Sharing 6 Net Profit Income Statement: ANDREWS BALDWIN ??? $ 40,979 $ $ 45,0815 31,653 $ $ 3,535 $ 2,704 $ 11,613 ???S $ $ $ 150 $ $ $ 4,742 S 11,077) $ $ 1,474 $ 2,469 $ $ 1,102 $ (1,190) 5 $ 43 $ $ $ 2,123 722 CHESTER 57,274 45,466 $ ??? $ 10425 (89) $ 11,339) $ 5,681 $ 124171 $ S 722 DIGBY ??? 74,330 4,411 19,255 350 13,538 2,779 5,545 105 ??? ANDREWS ??? BALDWIN ??? CHESTER ??? DIGBY ??? G FINANCIALS: 70 Sales Financial Statement Analysis + + 90% AutoSave OFF OFF A5 HEU 5 Financial Analysis Home Insert Draw Page Layout Formulas Data Review View Tell me Share Comments v Y y Get Add ins b? ti V V TT Equation Slicer 0.1 Maps Bivotchart A Pictures Shapes icons Sparklines Link Text Pivot Table Recommended Table Pivot Tables Data from Picture V Hecommended Charts 6 My Add-ins al Timeline NEW Comment Symbol M23 xfx T B D E G H 1 J K M N 0 0 P 0 R 5 R Other Fees/Writeoffs! ( 1 EBIT 64 interest (Short Term/Long Term) 65 Taxes G6 Profit Sharing G Net Profit $ $ $ $ $ $ 150 $ 4,742 $ 1,474 $ 1,102 $ S 43 $ 2,123 $ 11,0771 2,4695 (1,1901 $ $ $ 727 (89) $ 11,339) $ 5,681 5 12,4471 $ $ S 722 350 13,528 2,779 5,545 105 ??? DIGBY ??? 731 FINANCIALS: ANDREWS 70 Sales ??? 73 EBIT ??? 72 Net Profit 777 SG&A% 222 74 Contribution Margins % ??? 75 Emergency Loans ??? 76 RATIOS: ANDREWS 77 Return on Assets Return on Equity 222 7 Return on Sales ??? 30 Asset Turnover ??? B2 Leverage ??? B2 Analysis Questions (Briefly explain in 2-3 sentences): & 1) Which Company is performing the best and 84 using the above key financials and ratios? --> B3 BALDWIN ??? ??? 727 22? ??? ??? BALDWIN 777 222 ??? ??? 227 CHESTER ??? ??? 777 ??? ??? ??? CHESTER 777 222 ??? ??? ??? ??? 777 222 ??? ??? DIGBY 777 ??? ??? ??? ??? ) Which Company is performing the worst and As using the above key financials and ratios? --> SS 90 913) Explain the relationship between the income 00 Statement, Balance Sheet, and Cash Flows --> BS 92 194 95 T NI 97 BE DC Financial Statement Analysis + TE + 90%


