

Answered step by step
Verified Expert Solution
Question
1 Approved Answer
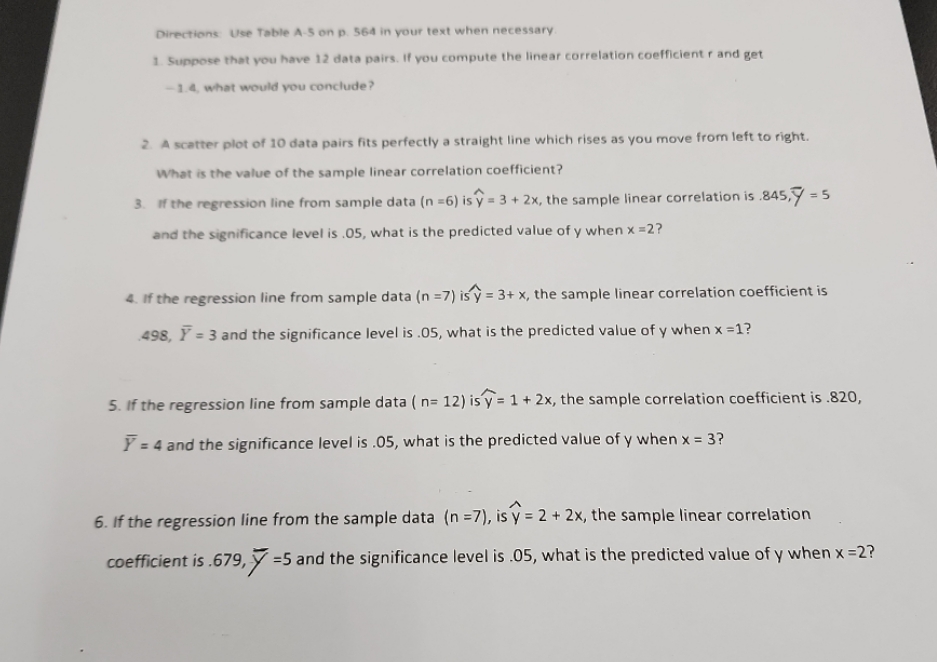
Directions Use Table A-5 on p. 564 in your text when necessary 1. Suppose that you have 12 data pairs. If you compute the linear
Step by Step Solution
There are 3 Steps involved in it
Step: 1

Get Instant Access to Expert-Tailored Solutions
See step-by-step solutions with expert insights and AI powered tools for academic success
Step: 2

Step: 3
Ace Your Homework with AI
Get the answers you need in no time with our AI-driven, step-by-step assistance
Get Started
Linear Algebra with Applications
Authors: Steven J. Leon
7th edition
131857851, 978-0131857858