DIRECTIONS!Summarize your analysis. Review your comments in the financial analysis section and provide your assessment of the overall status of the firm. Include any recommendations you think are appropriate.
List any other recommendations you have for the firm in view of your analysis.
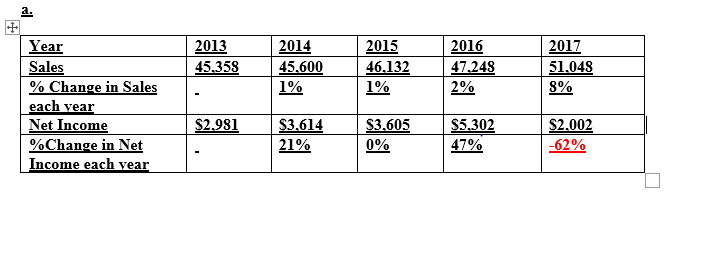
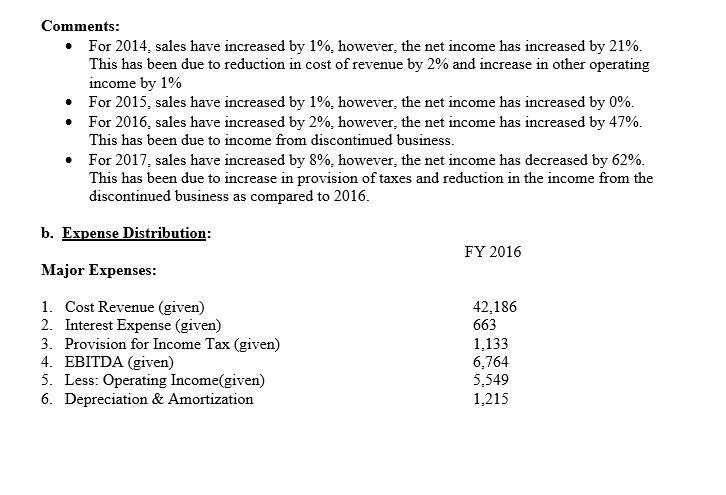
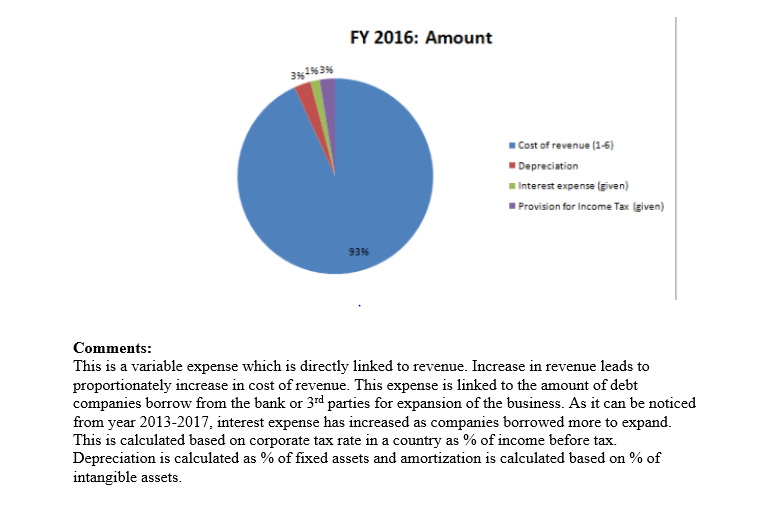
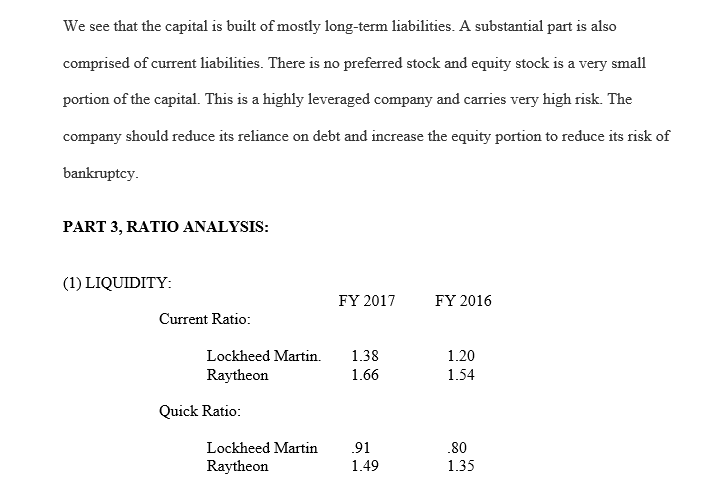
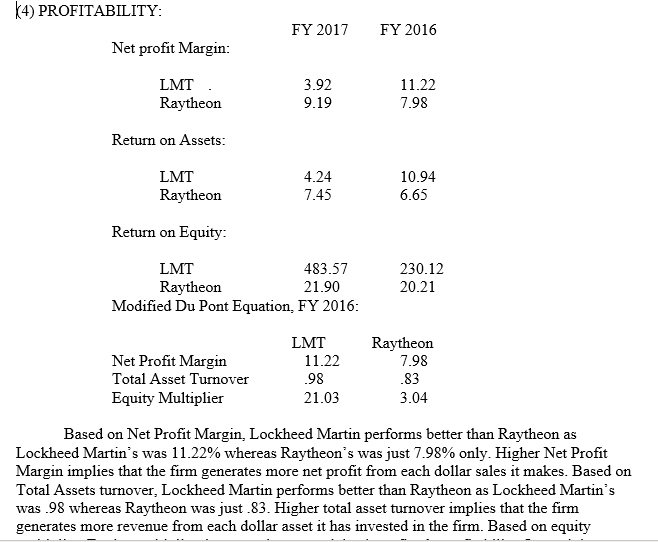
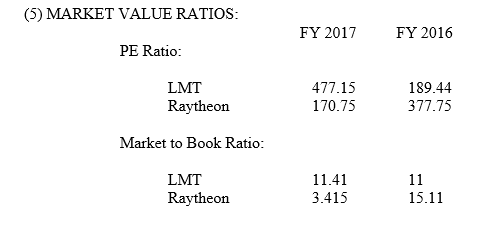
Year Sales % Change in Sales each vear Net Income %Change in Net Income each vear 2013 2015 46.13247.248 1% 2016 2017 51.048 2014 45.35845.600 1% 2% $2,981 3614 S3.605 S5.302 62% Comments For 2014, sales have increased by 1%, however, the net income has increased by 21%. This has been due to reduction in cost of revenue by 290 and increase in other operating income by 1% For 2015, sales have increased by 1%, however, the net income has increased by 0%. For 2016, sales have increased by 2%, however, the net income has increased by 47%. This has been due to income from discontinued business. For 2017, sales have increased by 8%, however, the net income has decreased by 62% This has been due to increase in provision of taxes and reduction in the income from the discontinued business as compared to 2016 e e b. Expense Distribution: FY 2016 Major Expenses 1. 2. 3. 4. 5. 6. Cost Revenue (given) Interest Expense (given) Provision for Income Tax (given) EBITDA (given) Less: Operating Income(given) Depreciation & Amortization 42,186 663 1,133 6.764 5,549 1.215 We see that the capital is built of mostly long-term liabilities. A substantial part is also comprised of current liabilities. There is no preferred stock and equity stock is a very small portion of the capital. This is a highly leveraged company and carries very high risk. The company should reduce its reliance on debt and increase the equity portion to reduce its risk of bankruptcy PART 3, RATIO ANALYSIS: (1) LIQUIDITY: FY 2017 FY 2016 Current Ratio: Lockheed Marti. 1.38 Raytheon 1.20 1.54 1.66 Quick Ratio: Lockheed Martin 91 Raytheon 80 1.35 1.49 4) PROFITABILITY FY 2017 FY 2016 Net profit Margin: LMT Raytheon 3.92 9.19 11.22 7.98 Return on Assets LMT Raytheon 4.24 7.45 10.94 6.65 Return on Equity: LMT Raytheon 483.57 21.90 230.12 20.21 Modified Du Pont Equation, FY 2016 LMTRaytheon Net Profit Margin Total Asset Turnover Equity Multiplier 11.22 98 21.03 7.98 83 3.04 Based on Net Profit Margin, Lockheed Martin performs better than Raytheon as Lockheed Martin's was 11.22% whereas Raytheon's was just 7.98% only. Higher Net Profit Margin implies that the firm generates more net profit from each dollar sales it makes. Based on Total Assets turnover, Lockheed Martin performs better than Raytheon as Lockheed Martin's was .98 whereas Raytheon was just .83. Higher total asset turnover implies that the firm generates more revenue from each dollar asset it has invested in the firm. Based on equity (5) MARKET VALUE RATIOS: FY 2017FY 2016 PE Ratio: LMT Raytheon 477.15 170.75 189.44 377.75 Market to Book Ratio: LMT Raytheon 11.41 3.415 15.11 Year Sales % Change in Sales each vear Net Income %Change in Net Income each vear 2013 2015 46.13247.248 1% 2016 2017 51.048 2014 45.35845.600 1% 2% $2,981 3614 S3.605 S5.302 62% Comments For 2014, sales have increased by 1%, however, the net income has increased by 21%. This has been due to reduction in cost of revenue by 290 and increase in other operating income by 1% For 2015, sales have increased by 1%, however, the net income has increased by 0%. For 2016, sales have increased by 2%, however, the net income has increased by 47%. This has been due to income from discontinued business. For 2017, sales have increased by 8%, however, the net income has decreased by 62% This has been due to increase in provision of taxes and reduction in the income from the discontinued business as compared to 2016 e e b. Expense Distribution: FY 2016 Major Expenses 1. 2. 3. 4. 5. 6. Cost Revenue (given) Interest Expense (given) Provision for Income Tax (given) EBITDA (given) Less: Operating Income(given) Depreciation & Amortization 42,186 663 1,133 6.764 5,549 1.215 We see that the capital is built of mostly long-term liabilities. A substantial part is also comprised of current liabilities. There is no preferred stock and equity stock is a very small portion of the capital. This is a highly leveraged company and carries very high risk. The company should reduce its reliance on debt and increase the equity portion to reduce its risk of bankruptcy PART 3, RATIO ANALYSIS: (1) LIQUIDITY: FY 2017 FY 2016 Current Ratio: Lockheed Marti. 1.38 Raytheon 1.20 1.54 1.66 Quick Ratio: Lockheed Martin 91 Raytheon 80 1.35 1.49 4) PROFITABILITY FY 2017 FY 2016 Net profit Margin: LMT Raytheon 3.92 9.19 11.22 7.98 Return on Assets LMT Raytheon 4.24 7.45 10.94 6.65 Return on Equity: LMT Raytheon 483.57 21.90 230.12 20.21 Modified Du Pont Equation, FY 2016 LMTRaytheon Net Profit Margin Total Asset Turnover Equity Multiplier 11.22 98 21.03 7.98 83 3.04 Based on Net Profit Margin, Lockheed Martin performs better than Raytheon as Lockheed Martin's was 11.22% whereas Raytheon's was just 7.98% only. Higher Net Profit Margin implies that the firm generates more net profit from each dollar sales it makes. Based on Total Assets turnover, Lockheed Martin performs better than Raytheon as Lockheed Martin's was .98 whereas Raytheon was just .83. Higher total asset turnover implies that the firm generates more revenue from each dollar asset it has invested in the firm. Based on equity (5) MARKET VALUE RATIOS: FY 2017FY 2016 PE Ratio: LMT Raytheon 477.15 170.75 189.44 377.75 Market to Book Ratio: LMT Raytheon 11.41 3.415 15.11