Discount Rate: Assuming a tax rate of 35%, the WACC the ADR holder should use to discount Pecoms cash flows. Project Pecoms free cash flows using exhibits 12, 13, and 14. Do not neglect the extraordinary FX losses. Project a terminal value, explaining how you arrived at the terminal value growth rate. Discount the cash flows and arrive at an enterprise value
Harvard Case: Drilling South: Petrobras Evaluates Pecom
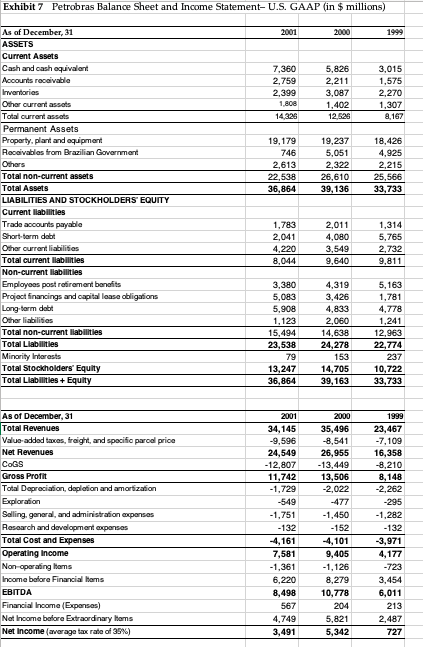
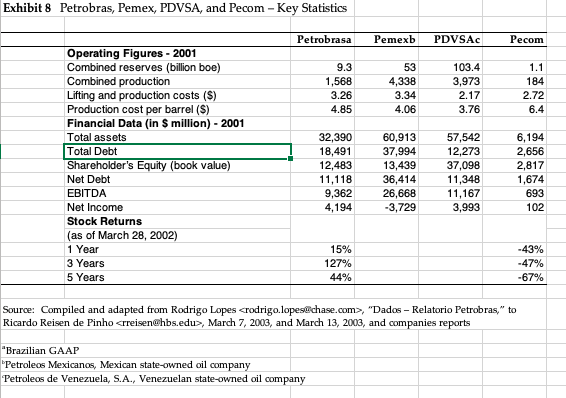

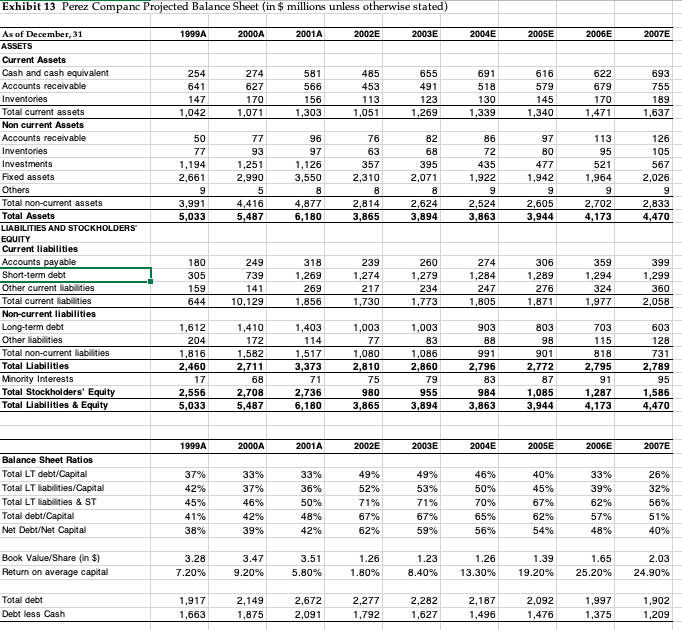
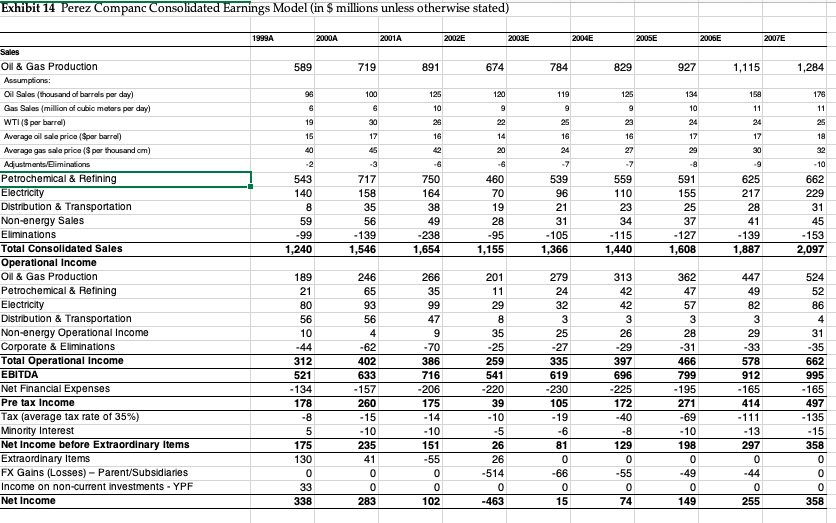
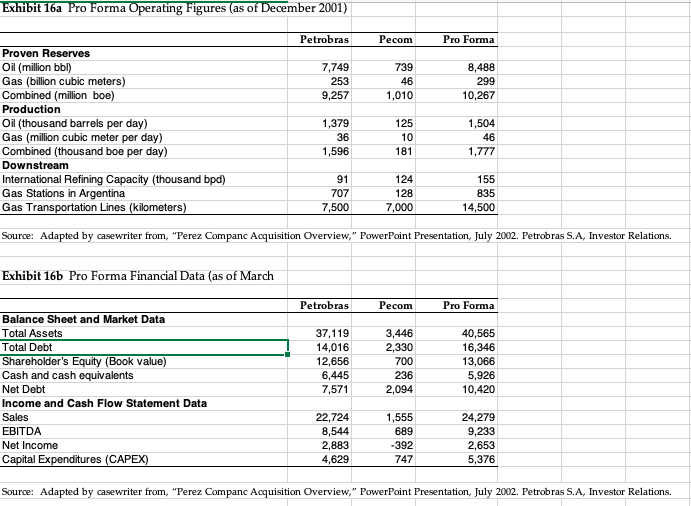

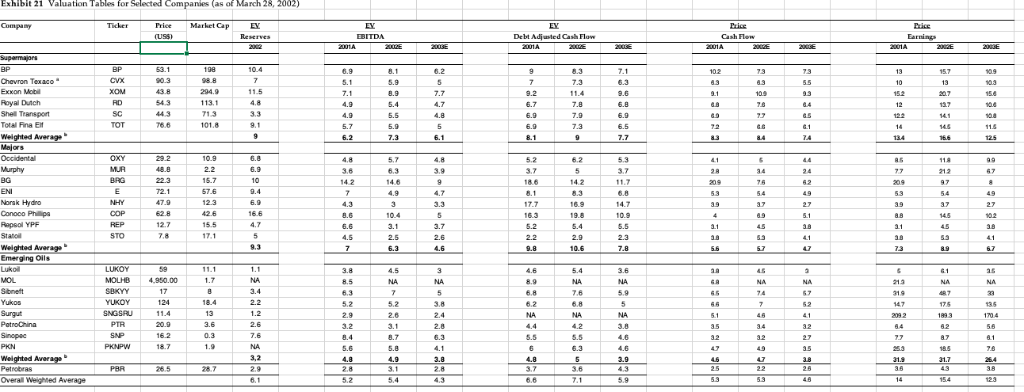
Exhibit 8 Petrobras, Pemex, PDVSA, and Pecom - Statistics Petrobrasa Pemexb PDVSAc Pecom Operating Figures 2001 Combined reserves (billion boe) Combined production Lifting and production costs (S) Production cost per barrel (S) Financial Data (in S million)-2001 Total assets Total Debt Shareholder's Equity (book value) Net Debt EBITDA Net Income Stock Returns (as of March 28, 2002) 1 Year 3 Years 5 Years 9.3 1,568 3.26 4.85 103.4 3,973 2.17 3.76 4,338 3.34 4 184 2.72 6.4 32,39060,913 37,994 13,439 36,414 26,668 3,729 18,491 12,483 11,118 9,362 4,194 57,542 12,273 37,098 11,348 11,167 3,993 6,194 2,656 2,817 1,674 102 15% 127% 44% ,47% Source: Compiled and adapted from Rodrigo Lopes crodrigo.lopes@chase.com>, "Dados - Relatorio Petrobras," to Ricardo Reisen de Pinho
,March 7, 2003, and March 13, 2003, and companies reports Petroleos Mexicanos, Mexican state-owned oil company Petroleos de Venezuela, S.A., Venezuelan state-owned oil company rez Companc w Forecast (nmillions 2003E 2004E 2005E 2006E 2007E 1999A 2000A 2001A 2002E 192 317 10 519 .41 347 317 10 674 125 CASH FLOW Net income from operations Depreclation Exploration expense Gross Cash Flow - Perez Companc Eamings-unconsolidated affillates DiMidends-unconsoldated atfilates Gross Cash Flow - adjusted for equity affiliates Capital Expenditures Dividends Net Gross Cash Flow Discretionary Net Gross Cash Flow- Discretionary- adjusted for equity atfiliates 151 175 196 13 235 265 12 309 12 358 37 10 418 317 10 617 19 475 462 89 64 447 321 196 379 295 478 -491 574 -491 629 -491 258 456 576 65 178 184 352 73 125 175 207 210 160 122 85 19 -61 -411 Source: Adapted by casewriter from Frank J. McGann and Marcus Sequeira, "Perez Companc- Can it weather the storm?" Merrill Lynch, June 3, 2002, pg. 6. ft 14 Perez Companc Conso s Model (in $millions unless otherwise stated) 2001A 2007E Oil & Gas Production 719 891 674 1,115 1,284 Cil Salos (thousand of barrds par day) Gas Salos (millian of cubio matars par day) WTI($par barrd) Avarago ail sale price (Spar barr) Avarago gas sale price (S par thousand cm) 119 176 Petrochemical & Retining Electricity Distribution & Transportation Non-energy Sales Eliminations Total Consolidated Sales Operational Income Oil & Gas Production Petrochemical & Refining Electricity Distribution & Transportation Non-energy Operational Income Corporate & Eliminations Total Operational Income EBITDA Net Financial Expenses Pre tax Income Tax (average tax rate of 35%) Minonty Interest Net Income before Extraordinary Items Extraordinary Items FX Gains (Losses) -Parent/Subsidiaries Income on non-current investments YPF Net Income 750 164 591 155 140 158 110 139 1,546 238 1,654 105 1,366 127 1,608 139 1,887 153 2,097 1,240 1,155 1,440 189 201 447 312 521 134 178 259 541 716 206 175 335 619 230 105 578 912 165 414 995 165 497 135 157 225 172 195 271 175 130 235 151 129 198 358 514 338 102 74 149 255 358 orma Operating Figures (as o ber 2001 Petrobras 7,749 9,257 Pecom Pro Forma Proven Reserves Oil (million bbl) Gas (billion cubic meters) Combined (million boe) Production Oil (thousand barrels per day) Gas (million cubic meter per day) Combined (thousand boe per day) Downstream International Refining Capacity (thousand bpd) Gas Stations in Argentina Gas Trans 739 46 1,010 8,488 299 10,267 1,379 36 1,596 125 10 181 1,504 46 1,777 124 128 7,000 155 835 14,500 91 Lines (kilometers 7,500 Source: Adapted by casewriter from, "Perez Companc Acquisition Overview," PowerPoint Presentation, uly 2002. Petrobras S.AInvestor Relations. Exhibit 16b Pro Forma Financial Data (as of March Petrobras Pecom Pro Forma Balance Sheet and Market Data Total Assets Total Debt Shareholder's Equity (Book value) Cash and cash equivalents Net Debt Income and Cash Flow Statement Data 3,446 2,330 37,119 14,016 12,656 6,445 7,571 40,565 16,346 13,066 5,926 10,420 236 2,094 22,724 8,544 2,883 4,629 1,555 689 392 747 24,279 9,233 2,653 5,376 EBITDA Net Income CA Source: Adapted by casewriter from, "Perez Companc Acquisition Overview," PowerPoint Presentation, uly 2002. Petrobras S.AInvestor Relations. Exhibit 21 Valuation Tables for Selected Companies (as of March 28, 2002 Price Market Ca EY Debt Adjuted Cash Flow Cash low Shell Transport Conoco Ph pa Exhibit 8 Petrobras, Pemex, PDVSA, and Pecom - Statistics Petrobrasa Pemexb PDVSAc Pecom Operating Figures 2001 Combined reserves (billion boe) Combined production Lifting and production costs (S) Production cost per barrel (S) Financial Data (in S million)-2001 Total assets Total Debt Shareholder's Equity (book value) Net Debt EBITDA Net Income Stock Returns (as of March 28, 2002) 1 Year 3 Years 5 Years 9.3 1,568 3.26 4.85 103.4 3,973 2.17 3.76 4,338 3.34 4 184 2.72 6.4 32,39060,913 37,994 13,439 36,414 26,668 3,729 18,491 12,483 11,118 9,362 4,194 57,542 12,273 37,098 11,348 11,167 3,993 6,194 2,656 2,817 1,674 102 15% 127% 44% ,47% Source: Compiled and adapted from Rodrigo Lopes crodrigo.lopes@chase.com>, "Dados - Relatorio Petrobras," to Ricardo Reisen de Pinho ,March 7, 2003, and March 13, 2003, and companies reports Petroleos Mexicanos, Mexican state-owned oil company Petroleos de Venezuela, S.A., Venezuelan state-owned oil company rez Companc w Forecast (nmillions 2003E 2004E 2005E 2006E 2007E 1999A 2000A 2001A 2002E 192 317 10 519 .41 347 317 10 674 125 CASH FLOW Net income from operations Depreclation Exploration expense Gross Cash Flow - Perez Companc Eamings-unconsolidated affillates DiMidends-unconsoldated atfilates Gross Cash Flow - adjusted for equity affiliates Capital Expenditures Dividends Net Gross Cash Flow Discretionary Net Gross Cash Flow- Discretionary- adjusted for equity atfiliates 151 175 196 13 235 265 12 309 12 358 37 10 418 317 10 617 19 475 462 89 64 447 321 196 379 295 478 -491 574 -491 629 -491 258 456 576 65 178 184 352 73 125 175 207 210 160 122 85 19 -61 -411 Source: Adapted by casewriter from Frank J. McGann and Marcus Sequeira, "Perez Companc- Can it weather the storm?" Merrill Lynch, June 3, 2002, pg. 6. ft 14 Perez Companc Conso s Model (in $millions unless otherwise stated) 2001A 2007E Oil & Gas Production 719 891 674 1,115 1,284 Cil Salos (thousand of barrds par day) Gas Salos (millian of cubio matars par day) WTI($par barrd) Avarago ail sale price (Spar barr) Avarago gas sale price (S par thousand cm) 119 176 Petrochemical & Retining Electricity Distribution & Transportation Non-energy Sales Eliminations Total Consolidated Sales Operational Income Oil & Gas Production Petrochemical & Refining Electricity Distribution & Transportation Non-energy Operational Income Corporate & Eliminations Total Operational Income EBITDA Net Financial Expenses Pre tax Income Tax (average tax rate of 35%) Minonty Interest Net Income before Extraordinary Items Extraordinary Items FX Gains (Losses) -Parent/Subsidiaries Income on non-current investments YPF Net Income 750 164 591 155 140 158 110 139 1,546 238 1,654 105 1,366 127 1,608 139 1,887 153 2,097 1,240 1,155 1,440 189 201 447 312 521 134 178 259 541 716 206 175 335 619 230 105 578 912 165 414 995 165 497 135 157 225 172 195 271 175 130 235 151 129 198 358 514 338 102 74 149 255 358 orma Operating Figures (as o ber 2001 Petrobras 7,749 9,257 Pecom Pro Forma Proven Reserves Oil (million bbl) Gas (billion cubic meters) Combined (million boe) Production Oil (thousand barrels per day) Gas (million cubic meter per day) Combined (thousand boe per day) Downstream International Refining Capacity (thousand bpd) Gas Stations in Argentina Gas Trans 739 46 1,010 8,488 299 10,267 1,379 36 1,596 125 10 181 1,504 46 1,777 124 128 7,000 155 835 14,500 91 Lines (kilometers 7,500 Source: Adapted by casewriter from, "Perez Companc Acquisition Overview," PowerPoint Presentation, uly 2002. Petrobras S.AInvestor Relations. Exhibit 16b Pro Forma Financial Data (as of March Petrobras Pecom Pro Forma Balance Sheet and Market Data Total Assets Total Debt Shareholder's Equity (Book value) Cash and cash equivalents Net Debt Income and Cash Flow Statement Data 3,446 2,330 37,119 14,016 12,656 6,445 7,571 40,565 16,346 13,066 5,926 10,420 236 2,094 22,724 8,544 2,883 4,629 1,555 689 392 747 24,279 9,233 2,653 5,376 EBITDA Net Income CA Source: Adapted by casewriter from, "Perez Companc Acquisition Overview," PowerPoint Presentation, uly 2002. Petrobras S.AInvestor Relations. Exhibit 21 Valuation Tables for Selected Companies (as of March 28, 2002 Price Market Ca EY Debt Adjuted Cash Flow Cash low Shell Transport Conoco Ph pa


