DISCOVERY PROJECT Bridge Science OBJECTIVE To experience the process of collecting data and then analyzing the data using linear regression. If you want to build
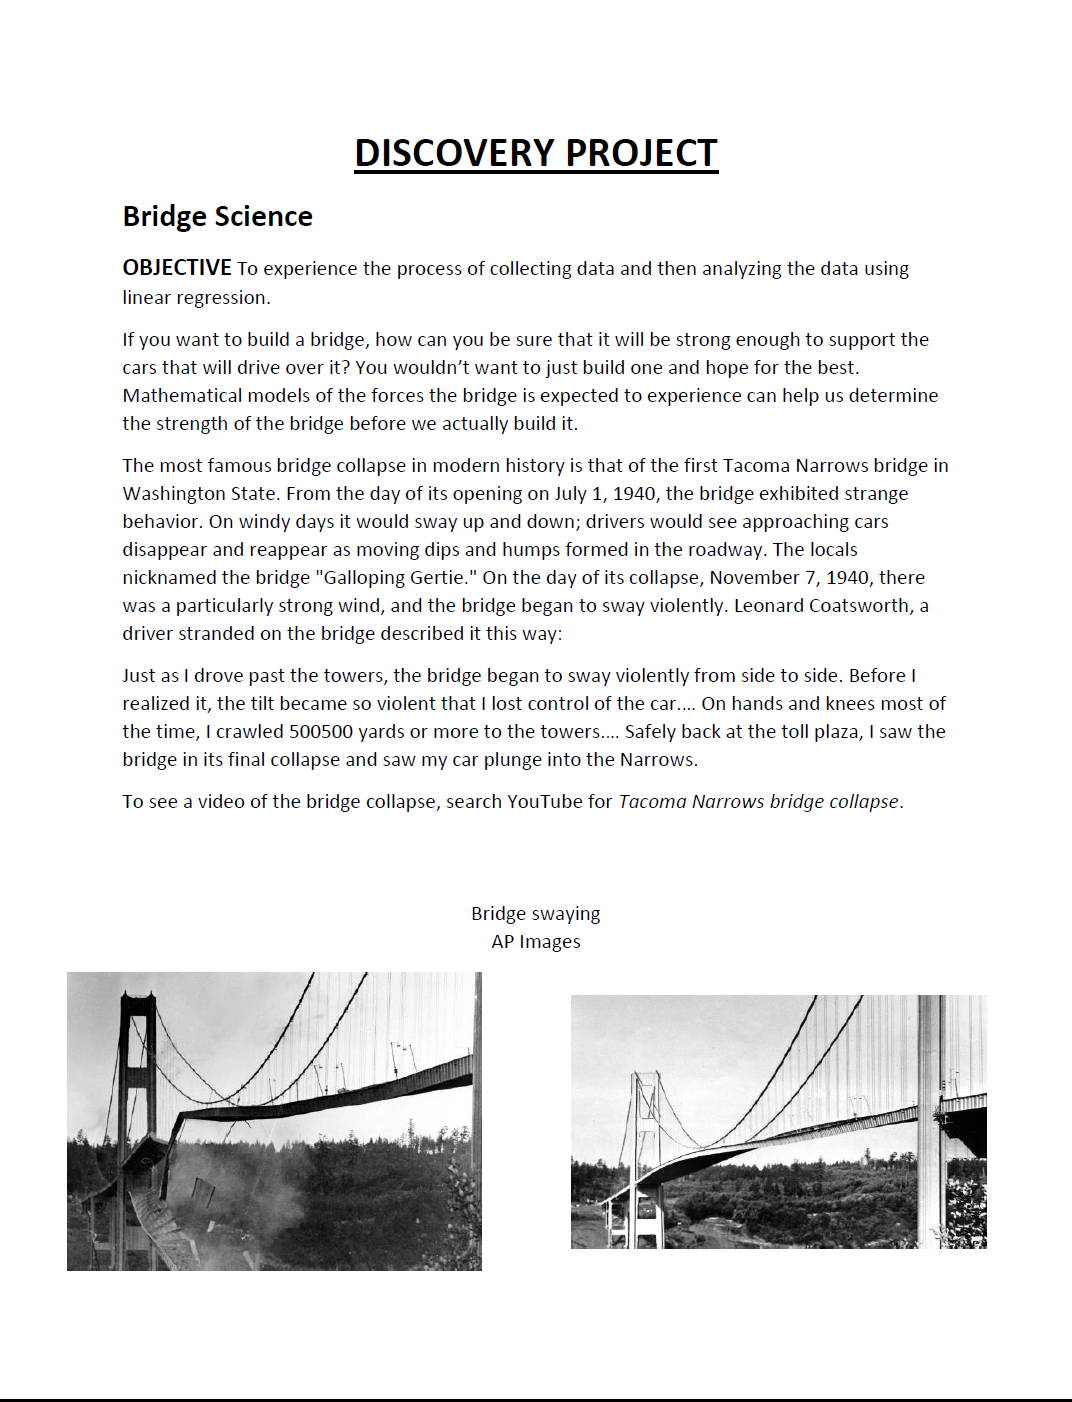
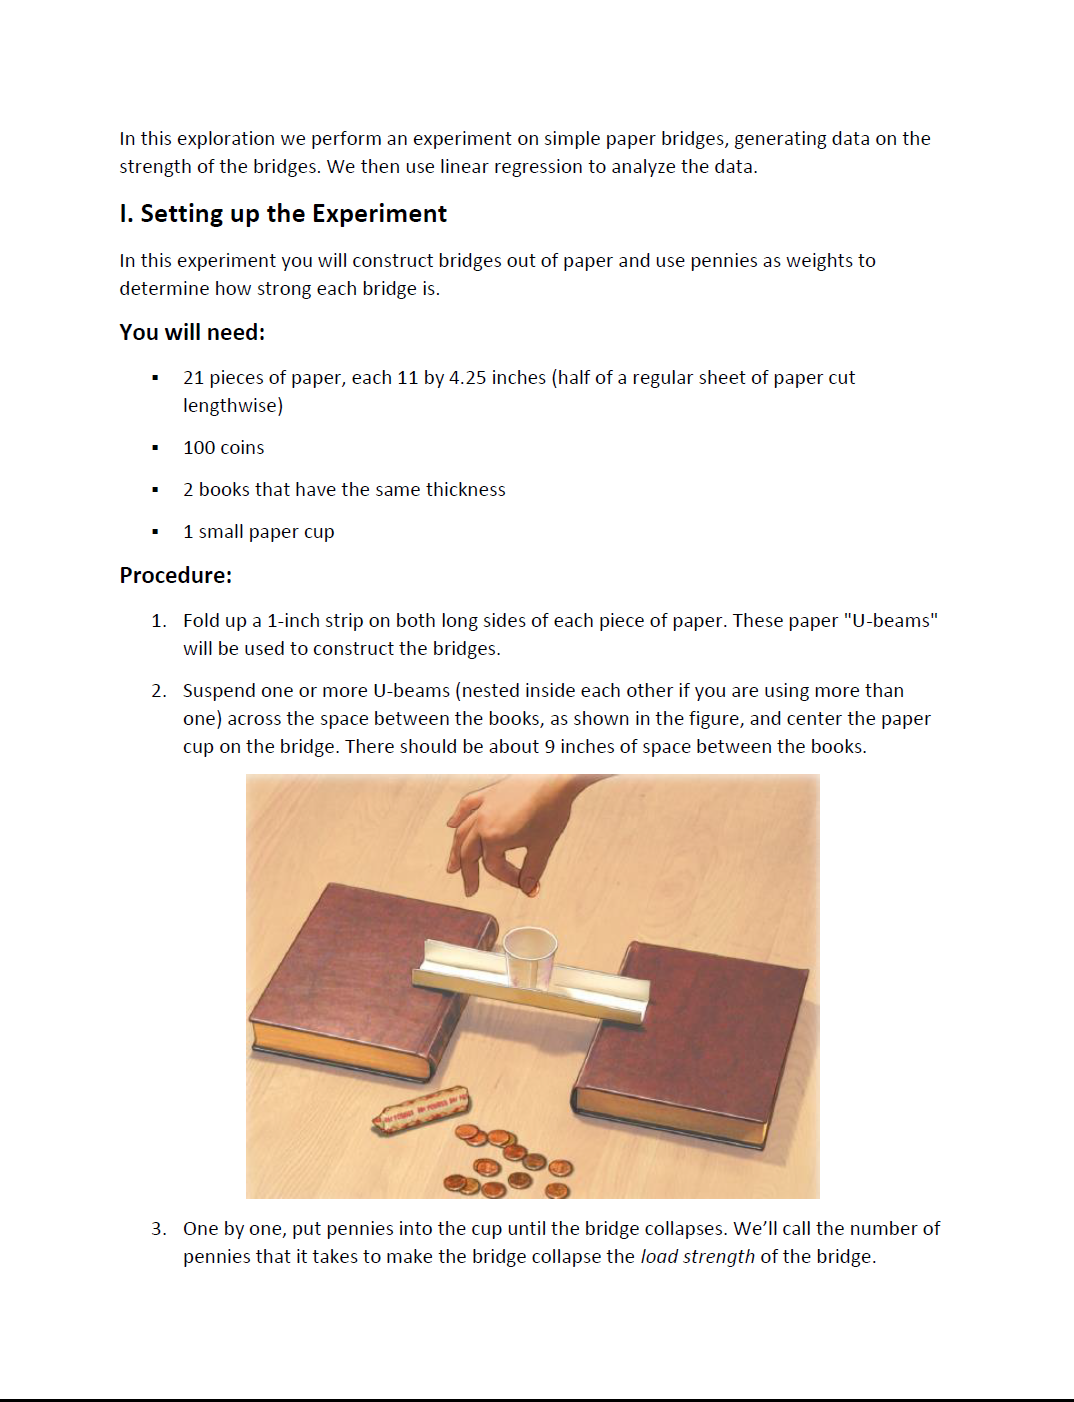
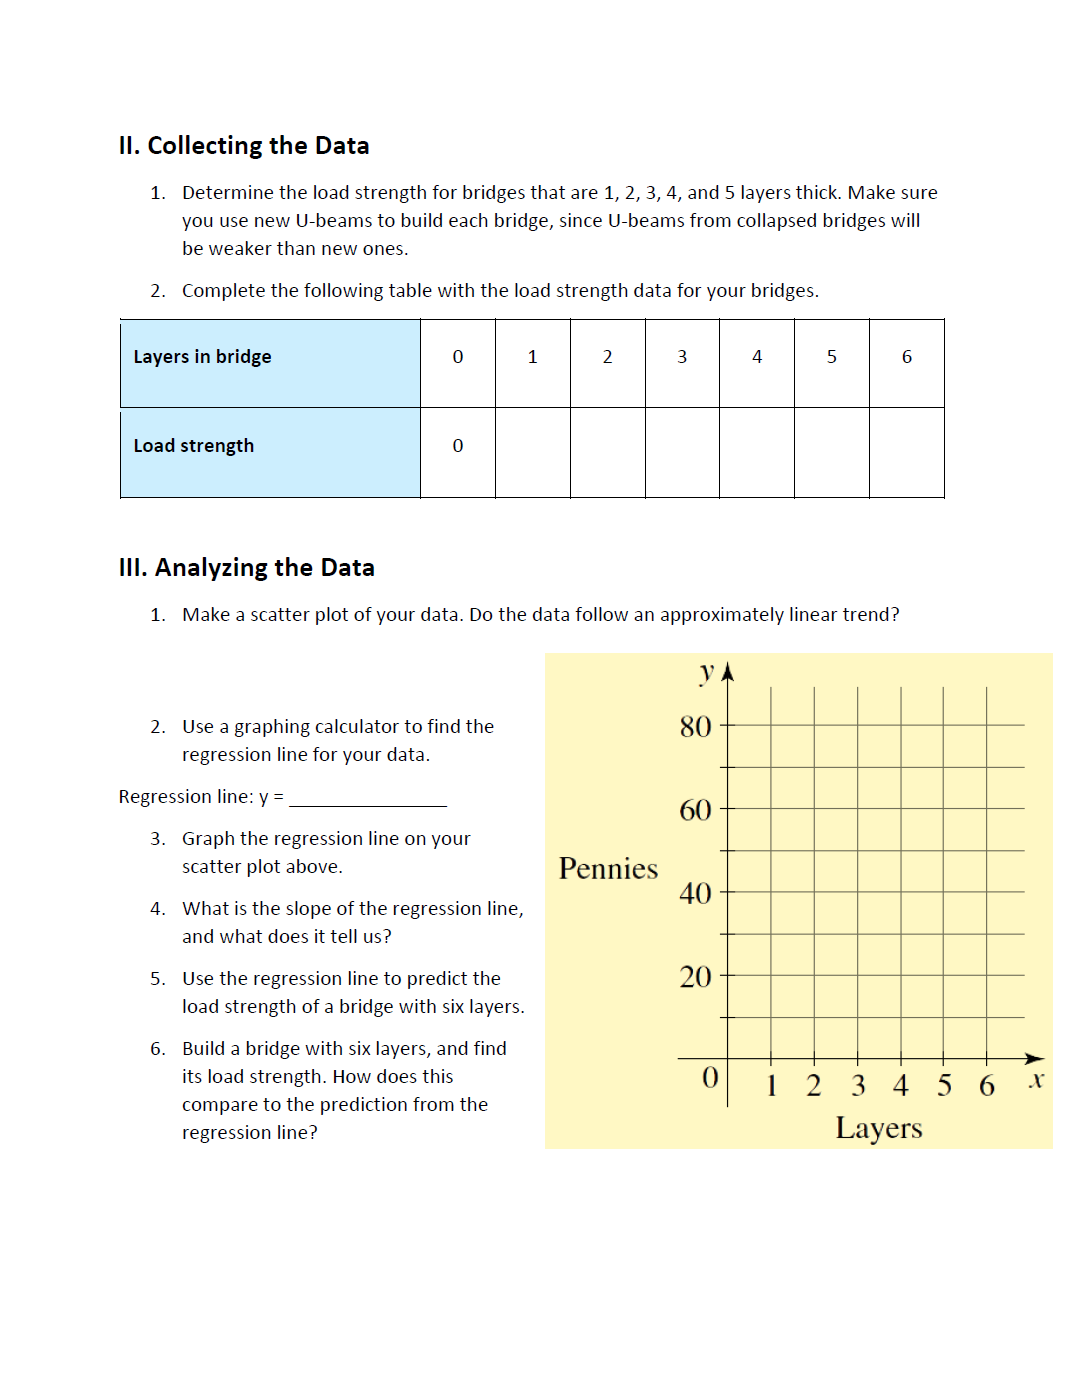
DISCOVERY PROJECT Bridge Science OBJECTIVE To experience the process of collecting data and then analyzing the data using linear regression. If you want to build a bridge, how can you be sure that it will be strong enough to support the cars that will drive over it? You wouldn't want to just build one and hope for the best. Mathematical models of the forces the bridge is expected to experience can help us determine the strength of the bridge before we actually build it. The most famous bridge collapse in modern history is that of the first Tacoma Narrows bridge in Washington State. From the day of its opening on July 1, 1940, the bridge exhibited strange behavior. 0n windy days it would sway up and down; drivers would see approaching cars disappear and reappear as moving dips and humps formed in the roadway. The locals nicknamed the bridge "Galloping Gertie." 0n the day of its collapse, November 7, 1940, there was a particularly strong wind, and the bridge began to sway violently. Leonard Coatsworth, a driver stranded on the bridge described it this way: Just as I drove past the towers, the bridge began to sway violently from side to side. Before I realized it, the tilt became so violent that I lost control of the car.... 0n hands and knees most of the time, | crawled 500500 yards or more to the towers.... Safely back at the toll plaza, I saw the bridge in its final collapse and saw my car plunge into the Narrows. To see a video of the bridge collapse, search YouTube for Tacoma Narrows bridge collapse. Bridge swaying AP Images In this exploration we perform an experiment on simple paper bridges, generating data on the strength of the bridges. We then use linear regression to analyze the data. I. Setting up the Experiment In this experiment you will construct bridges out of paper and use pennies as weights to determine how strong each bridge is. You will need: - 21 pieces of paper, each 11 by 4.25 inches {half of a regular sheet of paper cut lengthwise) - 100 coins - 2 books that have the same thickness - 1 small paper cup Procedure: 1. Fold up a 1inch strip on both long sides of each piece of paper. These paper "U-beams" will be used to construct the bridges. 2. Suspend one or more Ubeams (nested inside each other if you are using more than one) across the space between the books, as shown in the figure, and center the paper cup on the bridge. There should be about 9 inches of space between the books. 3. One by one, put pennies into the cup until the bridge collapses. We'll call the number of pennies that it takes to make the bridge collapse the load strength of the bridge. ll. Collecting the Data 1. Determine the load strength for bridges that are 1, 2, 3, 4, and 5 layers thick. Make sure you use new Ubeams to build each bridge, since Ubeams from collapsed bridges will be weaker than new ones. 2. Complete the following table with the load strength data for your bridges. Layers in bridge 0 Load strength 0 Ill. Analyzing the Data 1. Make a scatter plot of your data. Do the data follow an approximately linear trend? 2. Use a graphing calculator to find the regression line for your data. Regression line: y = 3. Graph the regression line on your scatter plot above. 4. What is the slope of the regression line, and what does it tell us? 5. Use the regression line to predict the load strength of a bridge with six layers. 6. Build a bridge with six layers, and find its load strength. How does this compare to the prediction from the regression line? V A 80 60 Pennies 40 20 2 3 4 5 6 Layers X
Step by Step Solution
There are 3 Steps involved in it
Step: 1
Get Instant Access to Expert-Tailored Solutions
See step-by-step solutions with expert insights and AI powered tools for academic success
Step: 2
Step: 3
Ace Your Homework with AI
Get the answers you need in no time with our AI-driven, step-by-step assistance