Discuss in details on diversification with reference to the efficient frontier and comparing the expected return and standard deviation of the optimal risky portfolio to the minimum-variance portfolio in your answer. how to explain I need Word limit: 2,500 thank you
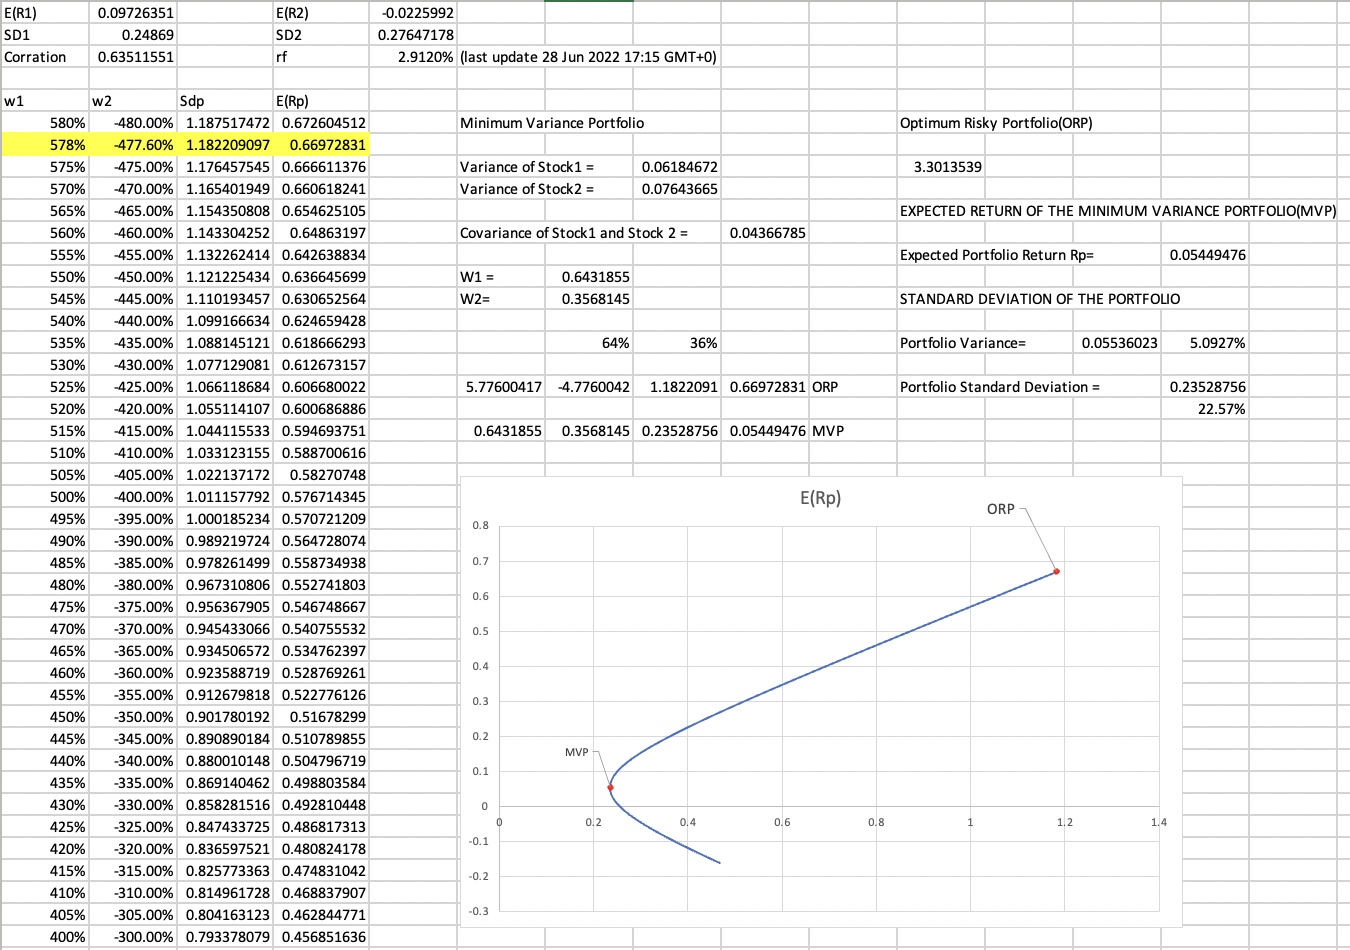
E(R1) SD1 Corration w1 0.09726351 0.24869 0.63511551 w2 Sdp E(Rp) 580% -480.00% 1.187517472 0.672604512 578% -477.60% 1.182209097 0.66972831 575% -475.00% 1.176457545 0.666611376 570% -470.00% 1.165401949 0.660618241 565% -465.00% 1.154350808 0.654625105 560% -460.00% 1.143304252 0.64863197 555% -455.00% 1.132262414 0.642638834 550% -450.00% 1.121225434 0.636645699 545% -445.00% 1.110193457 0.630652564 540% -440.00% 1.099166634 0.624659428 535% -435.00% 1.088145121 0.618666293 530% -430.00% 1.077129081 0.612673157 525% -425.00% 1.066118684 0.606680022 520% -420.00% 1.055114107 0.600686886 515% -415.00% 1.044115533 0.594693751 510% -410.00% 1.033123155 0.588700616 505% -405.00% 1.022137172 0.58270748 500% -400.00% 1.011157792 0.576714345 495% -395.00% 1.000185234 0.570721209 490% -390.00% 0.989219724 0.564728074 485% -385.00% 0.978261499 0.558734938 480% -380.00% 0.967310806 0.552741803 475% -375.00% 0.956367905 0.546748667 470% -370.00% 0.945433066 0.540755532 465% -365.00% 0.934506572 0.534762397 460% -360.00% 0.923588719 0.528769261 455% -355.00% 0.912679818 0.522776126 450% -350.00% 0.901780192 0.51678299 445% -345.00% 0.890890184 0.510789855 440% -340.00% 0.880010148 0.504796719 435% -335.00% 0.869140462 0.498803584 430% -330.00% 0.858281516 0.492810448 425% -325.00% 0.847433725 0.486817313 420% -320.00% 0.836597521 0.480824178 415% -315.00% 0.825773363 0.474831042 410% -310.00% 0.814961728 0.468837907 405% -305.00% 0.804163123 0.462844771 400% -300.00% 0.793378079 0.456851636 E(R2) SD2 rf -0.0225992 0.27647178 2.9120% (last update 28 Jun 2022 17:15 GMT+0) Minimum Variance Portfolio Variance of Stock1 = Variance of Stock2 = Covariance of Stock1 and Stock 2 = W1 = W2= 0.8 0.7 0.6 5.77600417 -4.7760042 1.1822091 0.66972831 ORP 0.5 0.6431855 0.3568145 0.23528756 0.05449476 MVP 0.4 0.3 0.2 0.1 0 -0.1 -0.2 0.6431855 0.3568145 -0.3 0 64% 0.06184672 0.07643665 MVP 36% 0.2 0.04366785 0,4 0.6 E(Rp) 0.8 Optimum Risky Portfolio(ORP) 3.3013539 EXPECTED RETURN OF THE MINIMUM VARIANCE PORTFOLIO(MVP) Expected Portfolio Return Rp= STANDARD DEVIATION OF THE PORTFOLIO Portfolio Variance= Portfolio Standard Deviation = 1 ORP 0.05536023 1.2 0.05449476 1.4 5.0927% 0.23528756 22.57% E(R1) SD1 Corration w1 0.09726351 0.24869 0.63511551 w2 Sdp E(Rp) 580% -480.00% 1.187517472 0.672604512 578% -477.60% 1.182209097 0.66972831 575% -475.00% 1.176457545 0.666611376 570% -470.00% 1.165401949 0.660618241 565% -465.00% 1.154350808 0.654625105 560% -460.00% 1.143304252 0.64863197 555% -455.00% 1.132262414 0.642638834 550% -450.00% 1.121225434 0.636645699 545% -445.00% 1.110193457 0.630652564 540% -440.00% 1.099166634 0.624659428 535% -435.00% 1.088145121 0.618666293 530% -430.00% 1.077129081 0.612673157 525% -425.00% 1.066118684 0.606680022 520% -420.00% 1.055114107 0.600686886 515% -415.00% 1.044115533 0.594693751 510% -410.00% 1.033123155 0.588700616 505% -405.00% 1.022137172 0.58270748 500% -400.00% 1.011157792 0.576714345 495% -395.00% 1.000185234 0.570721209 490% -390.00% 0.989219724 0.564728074 485% -385.00% 0.978261499 0.558734938 480% -380.00% 0.967310806 0.552741803 475% -375.00% 0.956367905 0.546748667 470% -370.00% 0.945433066 0.540755532 465% -365.00% 0.934506572 0.534762397 460% -360.00% 0.923588719 0.528769261 455% -355.00% 0.912679818 0.522776126 450% -350.00% 0.901780192 0.51678299 445% -345.00% 0.890890184 0.510789855 440% -340.00% 0.880010148 0.504796719 435% -335.00% 0.869140462 0.498803584 430% -330.00% 0.858281516 0.492810448 425% -325.00% 0.847433725 0.486817313 420% -320.00% 0.836597521 0.480824178 415% -315.00% 0.825773363 0.474831042 410% -310.00% 0.814961728 0.468837907 405% -305.00% 0.804163123 0.462844771 400% -300.00% 0.793378079 0.456851636 E(R2) SD2 rf -0.0225992 0.27647178 2.9120% (last update 28 Jun 2022 17:15 GMT+0) Minimum Variance Portfolio Variance of Stock1 = Variance of Stock2 = Covariance of Stock1 and Stock 2 = W1 = W2= 0.8 0.7 0.6 5.77600417 -4.7760042 1.1822091 0.66972831 ORP 0.5 0.6431855 0.3568145 0.23528756 0.05449476 MVP 0.4 0.3 0.2 0.1 0 -0.1 -0.2 0.6431855 0.3568145 -0.3 0 64% 0.06184672 0.07643665 MVP 36% 0.2 0.04366785 0,4 0.6 E(Rp) 0.8 Optimum Risky Portfolio(ORP) 3.3013539 EXPECTED RETURN OF THE MINIMUM VARIANCE PORTFOLIO(MVP) Expected Portfolio Return Rp= STANDARD DEVIATION OF THE PORTFOLIO Portfolio Variance= Portfolio Standard Deviation = 1 ORP 0.05536023 1.2 0.05449476 1.4 5.0927% 0.23528756 22.57%


