

Question
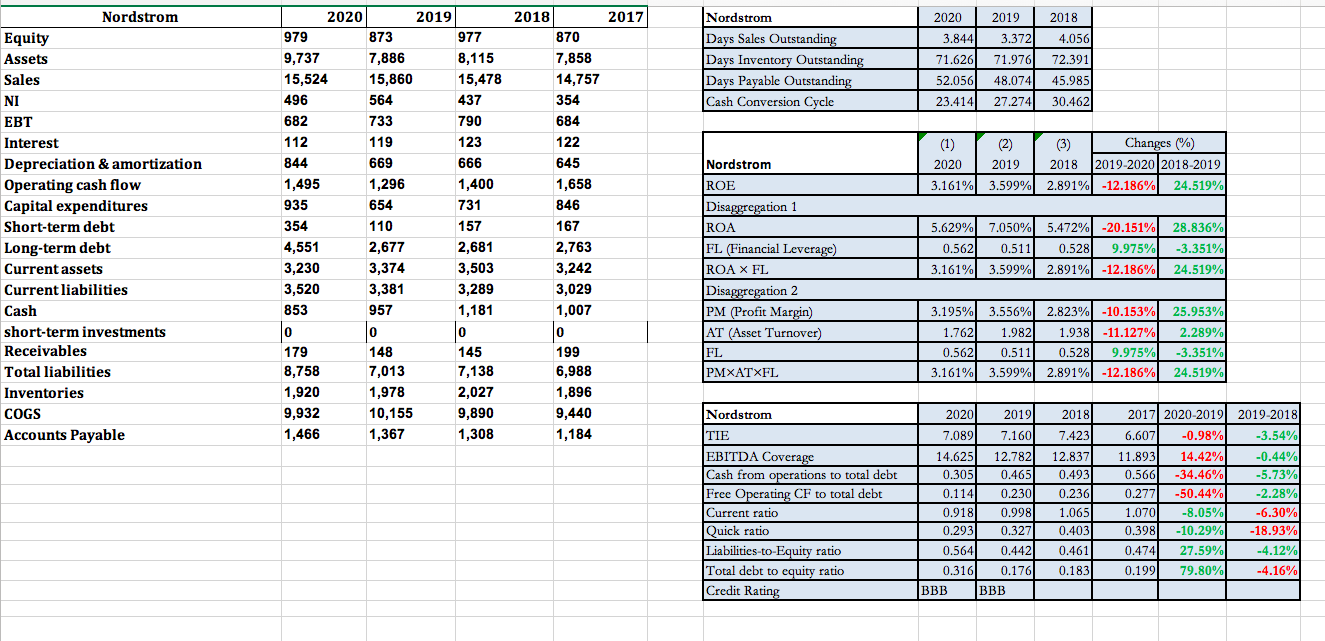
Discuss on Credit Risk of Nordstrom Time-series analysis Analyze credit risk in the past and current years (You may obtain information about firms credit ratings
 Discuss on Credit Risk of Nordstrom
Time-series analysis
Analyze credit risk in the past and current years (You may obtain information about firms credit ratings from financial articles as well); trend analysis
Cross-sectional analysis
- How do you think about current and future firm value?
Discuss on Profitability:
- Time-series analysis
Analyze profitability in the past and current years;
Can you find patterns or trends over the three years?
Cross-sectional analysis
2020 2017 Nordstrom Days Sales Outstanding Days Inventory Outstanding Days Payable Outstanding Cash Conversion Cycle 2020 3.844 71.626 2019 3.372 71.976 48.074 2018 4.056 72.391 979 9,737 15,524 496 682 112 844 52.056 45.985 30.462 23.414 27.274 Nordstrom 2018 870 7,858 14,757 354 684 122 645 1,658 846 167 2,763 3,242 3,029 1,007 (1) (2) (3) Changes (%) 2020 2019 2018 2019-2020 2018-2019 3.161% 3.599% 2.891% -12.186% 24.519% Nordstrom Equity Assets Sales NI EBT Interest Depreciation & amortization Operating cash flow Capital expenditures Short-term debt Long-term debt Current assets Current liabilities Cash short-term investments Receivables Total liabilities Inventories COGS Accounts Payable 1,495 2019 873 977 7,886 8,115 15,860 15,478 564 437 733 790 119 123 669 666 1,296 1,400 654 731 110 157 2,677 2,681 3,374 3,503 3,381 3,289 957 1,181 0 0 148 145 7,013 7,138 1,978 2,027 10,155 9,890 1,367 1,308 28.836% 5.629% 7.050% 5.472% -20.151% 0.562 0.511 0.528 9.975%) 3.161% 3.599% 3.599% 2.891% -12.186% -3.351% 24.519% 935 354 4,551 3,230 3,520 853 0 179 8,758 1,920 9,932 1,466 ROE Disaggregation 1 ROA FL (Financial Leverage) ROA X FL Disaggregation 2 PM (Profit Margin) AT (Asset Turnover) FL PMXATXFL 0 3.195% 3.556% 2.823% -10.153% 1.762 1.982 1.938] -11.127% 0.562 0.511 0.528 9.975% 3.161% 3.599% 2.891% -12.186% 25.953% 2.289% -3.351% 24.519% 199 6,988 1,896 9,440 1,184 Nordstrom 2020 2019 2018 7.089 7.4231 TIE EBITDA Coverage Cash from operations to total debt Free Operating CF to total debt Current ratio Quick ratio Liabilities-to-Equity ratio Total debt to equity ratio Credit Rating 14.625 0.305 0.114 0.918 0.293 7.160 12.782 0.465 0.230 0.9981 12.837 0.493 0.236 1.065 0.403 2017 2020-2019 2019-2018 6.607 -0.98% -3.54% 11.8931 14.42% -0.44% 0.566 -34.46% -5.73% 0.277 -50.44% -2.28% 1.070 -8.05% -6.30% 0.398 -10.29% -18.93% 0.474 27.59% -4.12% 0.199 79.80% -4.16% 0.564 0.327 0.442 0.176 0.461 0.316 0.183 BBB BBB 2020 2017 Nordstrom Days Sales Outstanding Days Inventory Outstanding Days Payable Outstanding Cash Conversion Cycle 2020 3.844 71.626 2019 3.372 71.976 48.074 2018 4.056 72.391 979 9,737 15,524 496 682 112 844 52.056 45.985 30.462 23.414 27.274 Nordstrom 2018 870 7,858 14,757 354 684 122 645 1,658 846 167 2,763 3,242 3,029 1,007 (1) (2) (3) Changes (%) 2020 2019 2018 2019-2020 2018-2019 3.161% 3.599% 2.891% -12.186% 24.519% Nordstrom Equity Assets Sales NI EBT Interest Depreciation & amortization Operating cash flow Capital expenditures Short-term debt Long-term debt Current assets Current liabilities Cash short-term investments Receivables Total liabilities Inventories COGS Accounts Payable 1,495 2019 873 977 7,886 8,115 15,860 15,478 564 437 733 790 119 123 669 666 1,296 1,400 654 731 110 157 2,677 2,681 3,374 3,503 3,381 3,289 957 1,181 0 0 148 145 7,013 7,138 1,978 2,027 10,155 9,890 1,367 1,308 28.836% 5.629% 7.050% 5.472% -20.151% 0.562 0.511 0.528 9.975%) 3.161% 3.599% 3.599% 2.891% -12.186% -3.351% 24.519% 935 354 4,551 3,230 3,520 853 0 179 8,758 1,920 9,932 1,466 ROE Disaggregation 1 ROA FL (Financial Leverage) ROA X FL Disaggregation 2 PM (Profit Margin) AT (Asset Turnover) FL PMXATXFL 0 3.195% 3.556% 2.823% -10.153% 1.762 1.982 1.938] -11.127% 0.562 0.511 0.528 9.975% 3.161% 3.599% 2.891% -12.186% 25.953% 2.289% -3.351% 24.519% 199 6,988 1,896 9,440 1,184 Nordstrom 2020 2019 2018 7.089 7.4231 TIE EBITDA Coverage Cash from operations to total debt Free Operating CF to total debt Current ratio Quick ratio Liabilities-to-Equity ratio Total debt to equity ratio Credit Rating 14.625 0.305 0.114 0.918 0.293 7.160 12.782 0.465 0.230 0.9981 12.837 0.493 0.236 1.065 0.403 2017 2020-2019 2019-2018 6.607 -0.98% -3.54% 11.8931 14.42% -0.44% 0.566 -34.46% -5.73% 0.277 -50.44% -2.28% 1.070 -8.05% -6.30% 0.398 -10.29% -18.93% 0.474 27.59% -4.12% 0.199 79.80% -4.16% 0.564 0.327 0.442 0.176 0.461 0.316 0.183 BBB BBBStep by Step Solution
There are 3 Steps involved in it
Step: 1

Get Instant Access to Expert-Tailored Solutions
See step-by-step solutions with expert insights and AI powered tools for academic success
Step: 2

Step: 3
Ace Your Homework with AI
Get the answers you need in no time with our AI-driven, step-by-step assistance
Get Started
Grow Your Small Business Profits How I Find A 100K In Any Business In 45 Minutes
Authors: Sharon Coleman
1st Edition
B0C9S9CCZJ, 979-8850917258