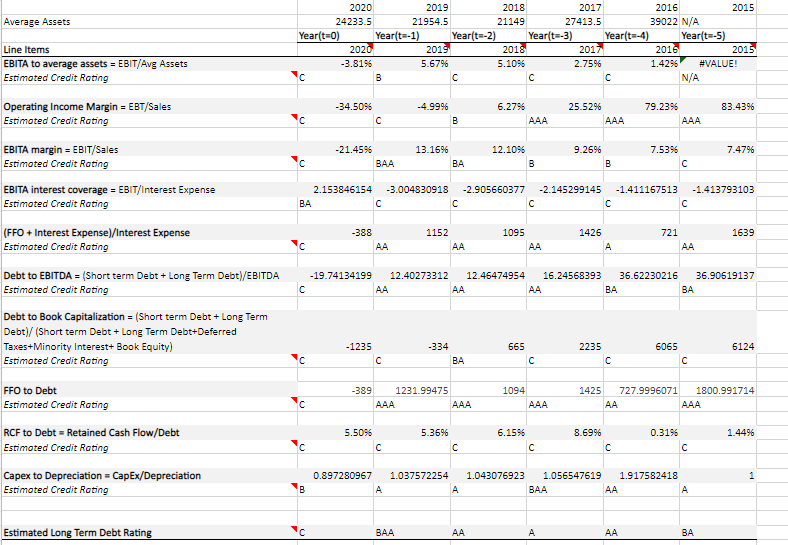
Discuss the reasons that the company got the rating that they did- Was there a particular ratio or ratios that dragged the rating down (up)? What is the company doing well (bad) at?

Average Assets 2020 2019 2018 2017 2016 2015 24233.5 21954.5 21149 27413.5 39022 N/A Year(t=0) Year(t-1) Year(t=-2) Year(t=-3) Year(t=-4) Year(-5) 2020 2019 2018 2017 2016 2015 -3.8196 5.6796 5.1096 2.7596 1.4296 #VALUE! B N/A Line Items EBITA to average assets = EBIT/Avg Assets Estimated Credit Rating 83.4396 -34.5096 -4.99% B 6.2796 AAA 25.5296 AAA 79.2395 AAA 7.4796 Operating Income Margin = EBT/Sales Estimated Credit Rating EBITA margin = EBIT/Sales Estimated Credit Rating EBITA interest coverage = EBIT/Interest Expense Estimated Credit Rating -21.4596 BAA 13.1696 BA 12.1096 B 9.2696 B 7.5396 -1.413793103 2.153846154 BA -3.004830918 -2.905660377 -2.145299145 C -1.411167513 1152 1426 1639 (FFO + Interest Expense)/Interest Expense Estimated Credit Rating -388 AA 1095 AA 721 AA AA -19.74134199 12.40273312 12.46474954 16.24568393 36.62230216 36.90619137 AA AA AA BA BA Debt to EBITDA = (Short term Debt + Long Term Debt)/EBITDA Estimated Credit Rating Debt to Book Capitalization = (Short term Debt + Long Term Debt)/(Short term Debt + Long Term Debt+Deferred Taxes+Minority Interest+ Book Equity) Estimated Credit Rating 6124 -1235 -334 BA 665 2235 6065 c FFO to Debt Estimated Credit Rating -389 1231.99475 AAA AAA 1094 AAA 1425 727.9996071 1800.991714 AA AAA 1.449 5.5096 5.3696 6.1996 8.69% 0.3195 RCF to Debt Retained Cash Flow/Debt Estimated Credit Rating Capex to Depreciation - Cap Ex/Depreciation Estimated Credit Rating = 1 0.897280967 A 1.037572254 A 1.043076923 1.056547619 1.917582418 BAA AA A B Estimated Long Term Debt Rating BAA AA AA BA Average Assets 2020 2019 2018 2017 2016 2015 24233.5 21954.5 21149 27413.5 39022 N/A Year(t=0) Year(t-1) Year(t=-2) Year(t=-3) Year(t=-4) Year(-5) 2020 2019 2018 2017 2016 2015 -3.8196 5.6796 5.1096 2.7596 1.4296 #VALUE! B N/A Line Items EBITA to average assets = EBIT/Avg Assets Estimated Credit Rating 83.4396 -34.5096 -4.99% B 6.2796 AAA 25.5296 AAA 79.2395 AAA 7.4796 Operating Income Margin = EBT/Sales Estimated Credit Rating EBITA margin = EBIT/Sales Estimated Credit Rating EBITA interest coverage = EBIT/Interest Expense Estimated Credit Rating -21.4596 BAA 13.1696 BA 12.1096 B 9.2696 B 7.5396 -1.413793103 2.153846154 BA -3.004830918 -2.905660377 -2.145299145 C -1.411167513 1152 1426 1639 (FFO + Interest Expense)/Interest Expense Estimated Credit Rating -388 AA 1095 AA 721 AA AA -19.74134199 12.40273312 12.46474954 16.24568393 36.62230216 36.90619137 AA AA AA BA BA Debt to EBITDA = (Short term Debt + Long Term Debt)/EBITDA Estimated Credit Rating Debt to Book Capitalization = (Short term Debt + Long Term Debt)/(Short term Debt + Long Term Debt+Deferred Taxes+Minority Interest+ Book Equity) Estimated Credit Rating 6124 -1235 -334 BA 665 2235 6065 c FFO to Debt Estimated Credit Rating -389 1231.99475 AAA AAA 1094 AAA 1425 727.9996071 1800.991714 AA AAA 1.449 5.5096 5.3696 6.1996 8.69% 0.3195 RCF to Debt Retained Cash Flow/Debt Estimated Credit Rating Capex to Depreciation - Cap Ex/Depreciation Estimated Credit Rating = 1 0.897280967 A 1.037572254 A 1.043076923 1.056547619 1.917582418 BAA AA A B Estimated Long Term Debt Rating BAA AA AA BA


