

Answered step by step
Verified Expert Solution
Question
1 Approved Answer
discuss the results Result Table 1: Centrifugal pump experimental results Runo RPM: Padm (bar) Pdisc SN (bar) (mm) C(L/m) Torque (Nm) Ht (m) Nh(w Nm
discuss the results 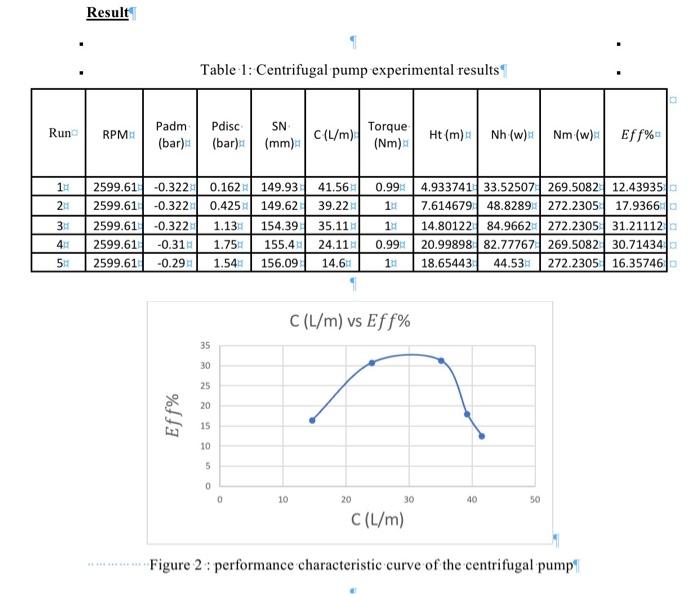
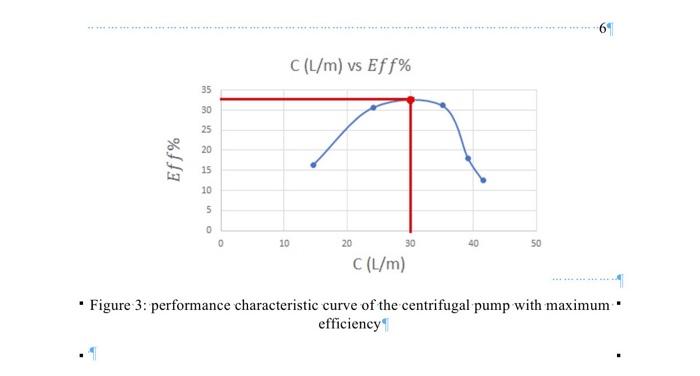
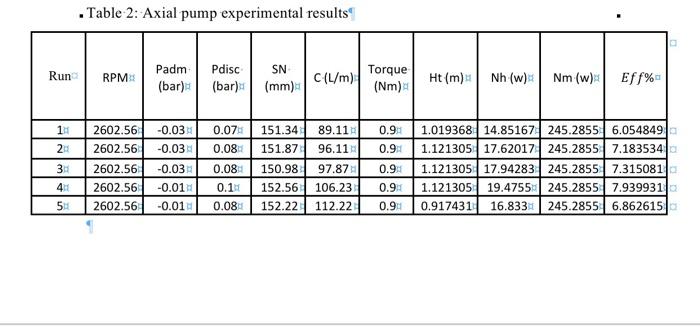
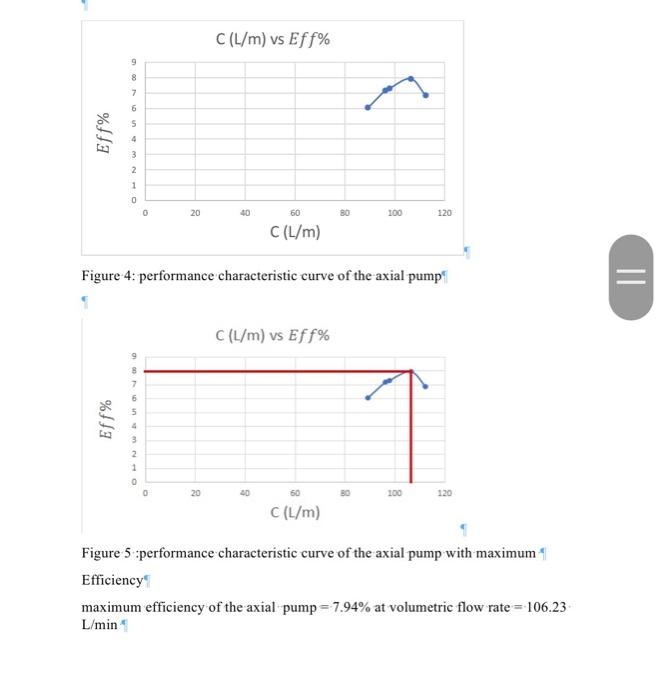
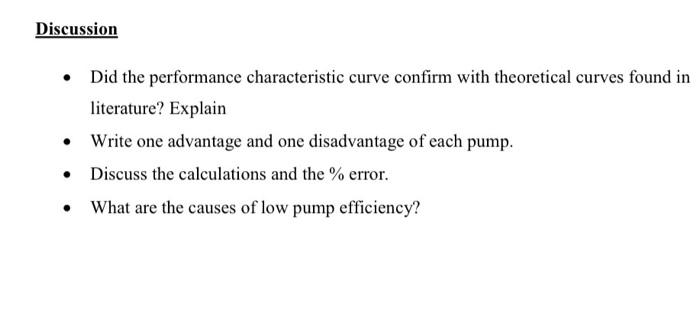
Result Table 1: Centrifugal pump experimental results Runo RPM: Padm (bar) Pdisc SN (bar) (mm) C(L/m) Torque (Nm) Ht (m) Nh(w Nm (W) Eff% 11 0.99 11 2599.61 -0.322 2599.61 -0.322 2599.61 -0.322 2599.61 -0.31 2599.61 -0.29 2 31 4 561 0.162 149.93 0.425 149.62 1.13 154.39 1.75 155.44 1.54-1 156.09 41.56 39.22 35.11 24.11 14.6 14 4.933741 33.52507 269.5082 12.43935 7.614679 48.8289 272.2305 | 17.9366 14.80122 84.9662272.2305 31.21112 20.99898 82.77767 269.5082 30.71434 18.65443 44.53 272.2305 16.35746 0.99 111 C(L/m) vs Eff% 35 30 25 20 Eff% 15 10 5 0 0 10 20 30 40 50 C(L/m) Figure 2 performance characteristic curve of the centrifugal pump C(L/m) vs Eff% 35 30 25 20 Eff% 15 10 5 0 0 10 20 30 40 50 C(L/m) . Figure 3: performance characteristic curve of the centrifugal pump with maximum efficiency Table 2: Axial pump experimental results Run RPM Padm (bar) Pdisc SN (bar) (mm) C(L/m) Torque (Nm) Ht (m) Nh (w) Nm (W) Eff% 11 24 2602.56 2602.56 2602.56 2602.56 2602.56 3 4 5 -0.03 -0.03 -0.03 -0.01 -0.01% 0.074 0.08 0.08 0.1 0.08 151.34 151.87 150.98 89.11 96.11 97.87 106.23 112.22 0.9 0.91 0.9 0.9 0.91 1.019368 14.85167 245.28556.054849 1.121305 17.62017 245.2855 7.183534 1.121305 17.94283 245.2855 7.315081 1.121305 19.4755 245.2855 7.939931 0.917431 16.833 245.2855 6.862615 152.56 152.22 C(L/m) vs Eff% 9 8 Eff% 7 6 5 4 3 2 1 o 0 20 40 60 80 100 120 C(L/m) Figure 4: performance characteristic curve of the axial pump = C(L/m) vs Eff% 5 Eff% 4 3 2 1 0 20 100 120 C(L/m) Figure 5 :performance characteristic curve of the axial pump with maximum Efficiency maximum efficiency of the axial pump=7.94% at volumetric flow rate = 106.23 L/min Discussion . Did the performance characteristic curve confirm with theoretical curves found in literature? Explain Write one advantage and one disadvantage of each pump. Discuss the calculations and the % error. What are the causes of low pump efficiency Step by Step Solution
There are 3 Steps involved in it
Step: 1

Get Instant Access to Expert-Tailored Solutions
See step-by-step solutions with expert insights and AI powered tools for academic success
Step: 2

Step: 3
Ace Your Homework with AI
Get the answers you need in no time with our AI-driven, step-by-step assistance
Get Started
Mass Transfer Processes Modeling Computations And Design
Authors: P. A. Ramachandran
1st Edition
0134675622, 978-0134675626