Discussion is below and activity, kindly answer asap and correctly for good rating
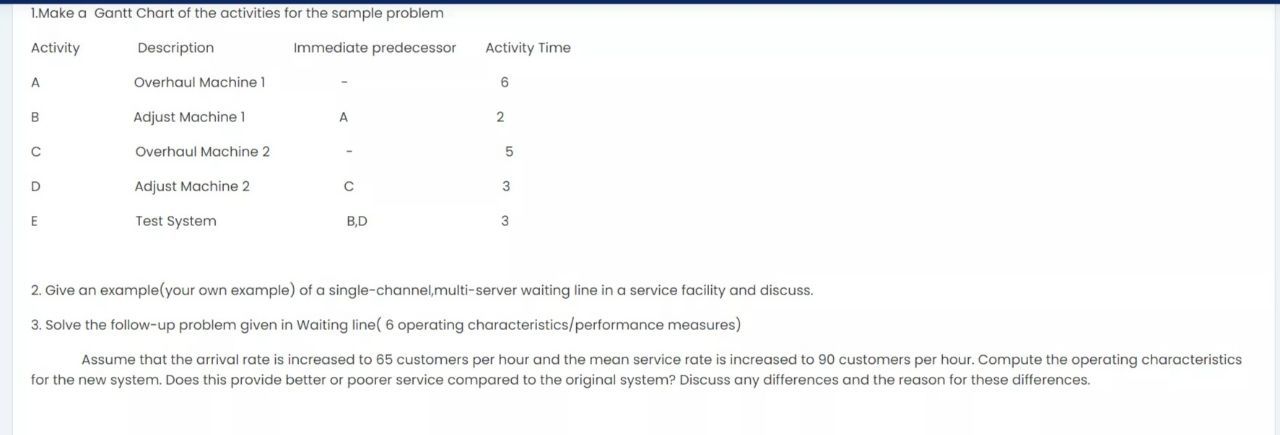
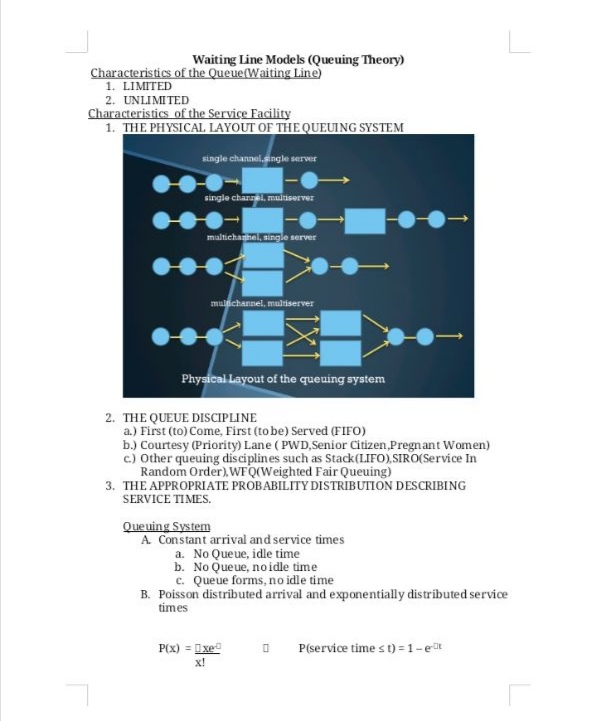
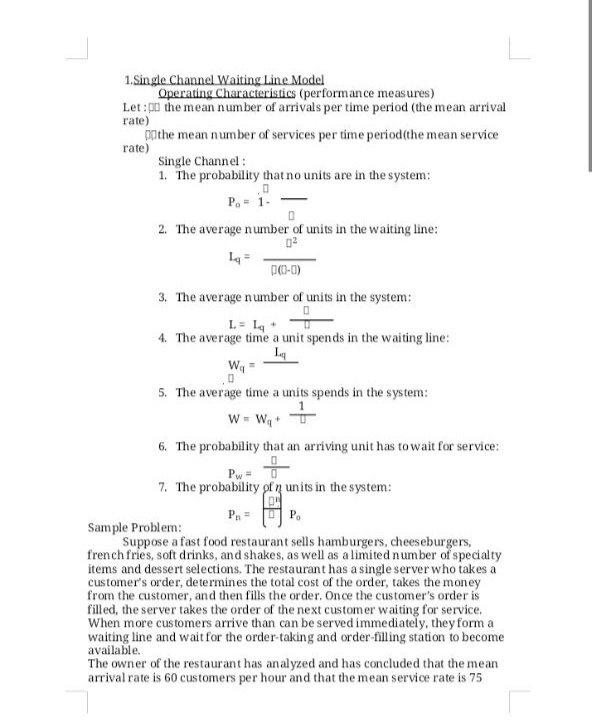
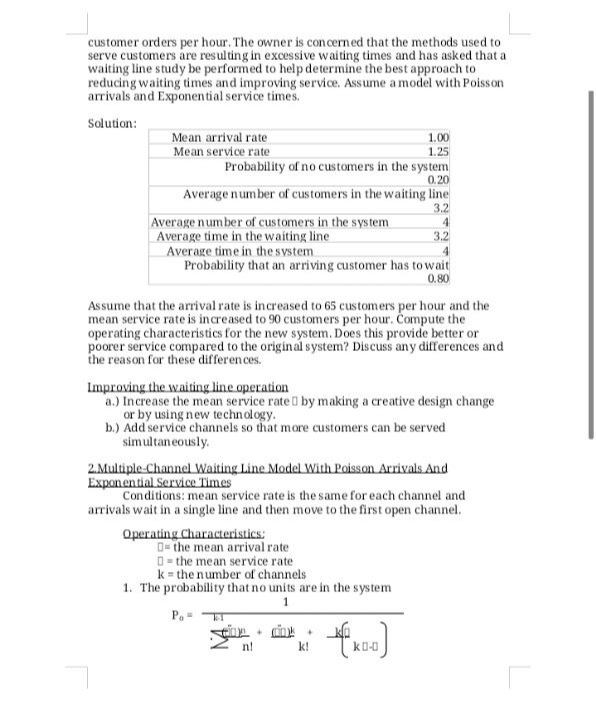
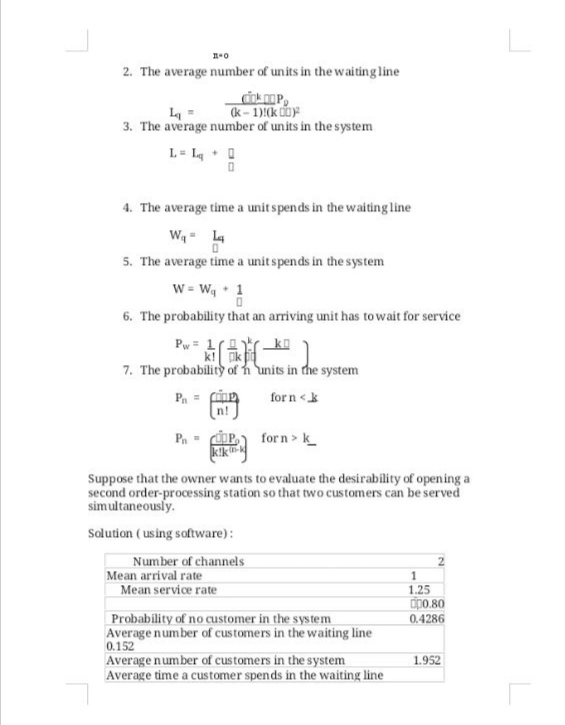
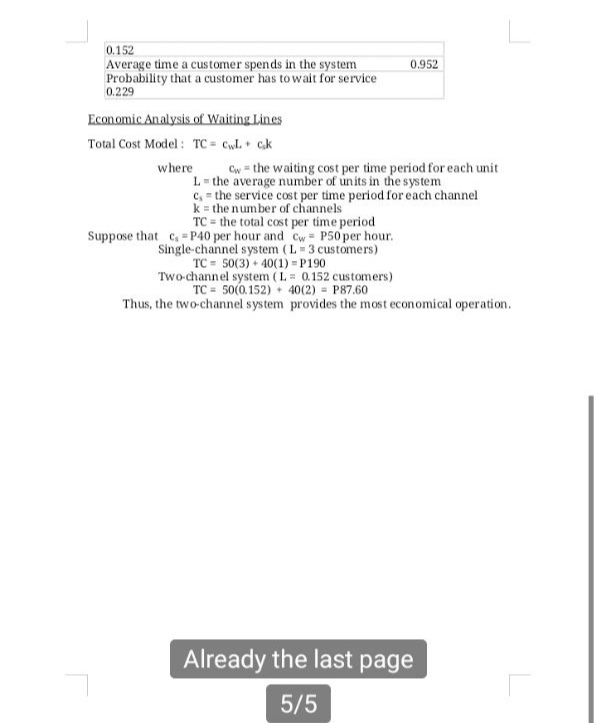
1.Make a Gantt Chart of the activities for the sample problem Activity Description Immediate predecessor Activity Time A Overhaul Machine 1 B Adjust Machine 1 A N C Overhaul Machine 2 D Adjust Machine 2 C m Test System B,D 2. Give an example(your own example) of a single-channel,multi-server waiting line in a service facility and discuss. 3. Solve the follow-up problem given in Waiting line( 6 operating characteristics/performance measures) Assume that the arrival rate is increased to 65 customers per hour and the mean service rate is increased to 90 customers per hour. Compute the operating characteristics for the new system. Does this provide better or poorer service compared to the original system? Discuss any differences and the reason for these differences.L Waiting Line Models (Queuing Theory) Characteristics of the Queue(Waiting Line) 1. LIMITED 2. UNLIMITED Characteristics of the Service Facility 1. THE PHYSICAL LAYOUT OF THE QUEUING SYSTEM single channel, single server single channel, multiserver multichannel, single server multichannel, multiserver Physical Layout of the queuing system 2. THE QUEUE DISCIPLINE a.) First (to) Come, First (to be) Served (FIFO) b.) Courtesy (Priority) Lane ( PWD,Senior Citizen, Pregnant Women) c.) Other queuing disciplines such as Stack(LIFO), SIRO(Service In Random Order), WFQ(Weighted Fair Queuing) 3. THE APPROPRIATE PROBABILITY DISTRIBUTION DESCRIBING SERVICE TIMES. Queuing System A. Constant arrival and service times a. No Queue, idle time b. No Queue, no idle time c. Queue forms, no idle time B. Poisson distributed arrival and exponentially distributed service times P(x) = 0xe-0 P(service time s t) = 1-eat x!1. Single Channel Waiting Line Model Operating Characteristics (performance measures) Let : PD the mean number of arrivals per time period (the mean arrival rate) [the mean number of services per time period (the mean service rate) Single Channel : 1. The probability that no units are in the system: Po = 1- 2. The average number of units in the waiting line: 02 Lq = P(0-0) 3. The average number of units in the system: L = Lq + 4. The average time a unit spends in the waiting line: Wg = 5. The average time a units spends in the system: W = Wg+ T 6. The probability that an arriving unit has to wait for service: 7. The probability of n units in the system: Pn = P Sample Problem: Suppose a fast food restaurant sells hamburgers, cheeseburg french fries, soft drinks, and shakes, as well as a limited number of specialty items and dessert selections. The restaurant has a single server who takes a customer's order, determines the total cost of the order, takes the money from the customer, and then fills the order. Once the customer's order is filled, the server takes the order of the next customer waiting for service. When more customers arrive than can be served immediately, they form a waiting line and wait for the order-taking and order-filling station to become available. The owner of the restaurant has analyzed and has concluded that the mean arrival rate is 60 customers per hour and that the mean service rate is 75customer orders per hour. The owner is concerned that the methods used to serve customers are resulting in excessive waiting times and has asked that a waiting line study be performed to help determine the best approach to reducing waiting times and improving service. Assume a model with Poisson arrivals and Exponential service times. Solution: Mean arrival rate 1.00 Mean service rate 1.25 Probability of no customers in the system 0.20 Average number of customers in the waiting line 3.2 Average number of customers in the system Average time in the waiting line 3.2 Average time in the system Probability that an arriving customer has to wait 0.80 Assume that the arrival rate is increased to 65 customers per hour and the mean service rate is increased to 90 customers per hour. Compute the operating characteristics for the new system. Does this provide better or poorer service compared to the original system? Discuss any differences and the reason for these differences. Improving the waiting line operation a.) Increase the mean service rate 0 by making a creative design change or by using new technology. b.) Add service channels so that more customers can be served simultaneously. 2. Multiple-Channel Waiting Line Model With Poisson Arrivals And Exponential Service Times Conditions: mean service rate is the same for each channel and arrivals wait in a single line and then move to the first open channel. Operating Characteristics: O= the mean arrival rate 0 - the mean service rate k = the number of channels 1. The probability that no units are in the system POET n!L 2. The average number of units in the waiting line CO OP, L = (k - 1)!(k Do) 3. The average number of units in the system L= Lq + 0 4. The average time a unit spends in the waiting line Wg = Lq 5. The average time a unit spends in the system W = Wq * 1 6. The probability that an arriving unit has to wait for service Pw = 1 7. The probability of n units in the system Pn = from for n <.k n pn="KTK" forn> k_ Suppose that the owner wants to evaluate the desirability of opening a second order-processing station so that two customers can be served simultaneously. Solution ( using software) : Number of channels 2 Mean arrival rate 1 Mean service rate 1.25 DOO.80 Probability of no customer in the system 0.4286 Average number of customers in the waiting line 0.152 Average number of customers in the system 1.952 Average time a customer spends in the waiting line0.152 Average time a customer spends in the system 0.952 Probability that a customer has to wait for service 0.229 Economic Analysis of Waiting Lines Total Cost Model : TC = cwL + ck where Cw = the waiting cost per time period for each unit L = the average number of units in the system cs = the service cost per time period for each channel k = the number of channels TC = the total cost per time period Suppose that c. =P40 per hour and Cw = P50 per hour. Single-channel system ( L = 3 customers) TC = 50(3) + 40(1) = P190 Two-channel system ( L = 0.152 customers) TC = 50(0.152) + 40(2) = P87.60 Thus, the two-channel system provides the most economical operation. Already the last page 5/5
