

Question
DISCUSSION QUESTION 6-1 MG665 Marketing Research Lesson 6: Oral and Written Research Presentations Discussion Question 1 (50 points) The management of Seal-Tight Company, a manufacturer
DISCUSSION QUESTION 6-1
MG665 Marketing Research
Lesson 6: Oral and Written Research Presentations
Discussion Question 1 (50 points)
The management of Seal-Tight Company, a manufacturer of metal cans, has presented you with the following information:
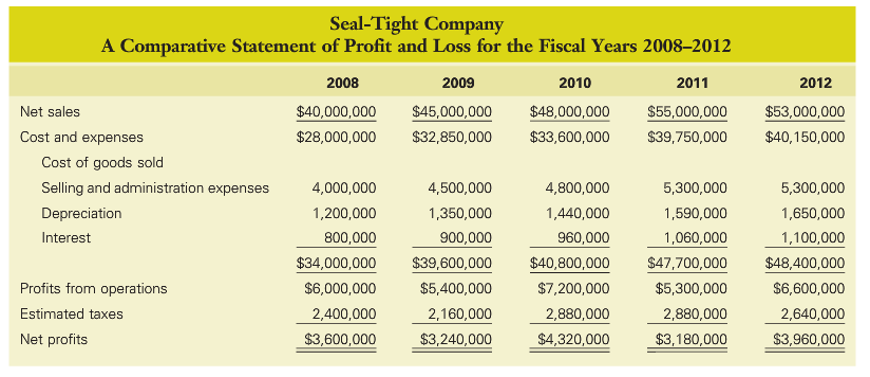
Develop a chart to present the companys net sales growth over the five-year period.
Develop a chart to compare the change in the net profit level with the change in the net sales level.
Develop a chart that will present the following expenses (excluding cost of goods sold) over the five-year period: selling and administration expenses, depreciation expenses, and interest expenses.
The management of Seal-Tight has the following sales data relating to its two major competitors:
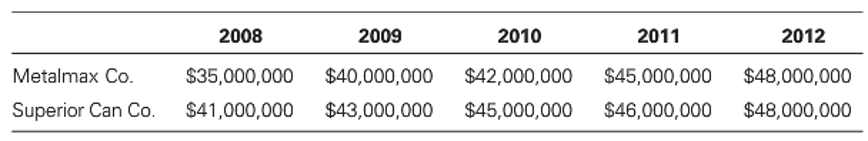
Prepare a chart to compare the sales performance of Seal-Tight Company with its major competitors. (50 points) (A 2-page response is required.)
Seal-Tight Company A Comparative Statement of Profit and Loss for the Fiscal Years 2008-2012 2010 2011 2012 2008 $40,000,000 $28,000,000 2009 $45,000,000 $32,850,000 $48,000,000 $33,600,000 $55,000,000 $39,750,000 $53,000,000 $40,150,000 Net sales Cost and expenses Cost of goods sold Selling and administration expenses Depreciation Interest 4,000,000 1,200,000 800,000 $34,000,000 $6,000,000 2,400,000 $3,600,000 4,500,000 1,350,000 900,000 $39,600,000 $5,400,000 2,160,000 $3,240,000 4,800,000 1,440,000 960,000 $40,800,000 $7,200,000 2,880,000 $4,320,000 5,300,000 1,590,000 1,060,000 $47,700,000 $5,300,000 2,880,000 $3,180,000 5,300,000 1,650,000 1,100,000 $48,400,000 $6,600,000 2,640,000 $3,960,000 Profits from operations Estimated taxes Net profits 2011 2012 Metalmax Co. Superior Can Co. 2008 $35,000,000 $41,000,000 2009 $40,000,000 $43,000,000 2010 $42,000,000 $45,000,000 $45,000,000 $46,000,000 $48,000,000 $48,000,000 Seal-Tight Company A Comparative Statement of Profit and Loss for the Fiscal Years 2008-2012 2010 2011 2012 2008 $40,000,000 $28,000,000 2009 $45,000,000 $32,850,000 $48,000,000 $33,600,000 $55,000,000 $39,750,000 $53,000,000 $40,150,000 Net sales Cost and expenses Cost of goods sold Selling and administration expenses Depreciation Interest 4,000,000 1,200,000 800,000 $34,000,000 $6,000,000 2,400,000 $3,600,000 4,500,000 1,350,000 900,000 $39,600,000 $5,400,000 2,160,000 $3,240,000 4,800,000 1,440,000 960,000 $40,800,000 $7,200,000 2,880,000 $4,320,000 5,300,000 1,590,000 1,060,000 $47,700,000 $5,300,000 2,880,000 $3,180,000 5,300,000 1,650,000 1,100,000 $48,400,000 $6,600,000 2,640,000 $3,960,000 Profits from operations Estimated taxes Net profits 2011 2012 Metalmax Co. Superior Can Co. 2008 $35,000,000 $41,000,000 2009 $40,000,000 $43,000,000 2010 $42,000,000 $45,000,000 $45,000,000 $46,000,000 $48,000,000 $48,000,000Step by Step Solution
There are 3 Steps involved in it
Step: 1

Get Instant Access to Expert-Tailored Solutions
See step-by-step solutions with expert insights and AI powered tools for academic success
Step: 2

Step: 3
Ace Your Homework with AI
Get the answers you need in no time with our AI-driven, step-by-step assistance
Get Started
Handbook Of Short Selling
Authors: Greg N. Gregoriou
1st Edition
0123877245, 978-0123877246