

Answered step by step
Verified Expert Solution
Question
1 Approved Answer
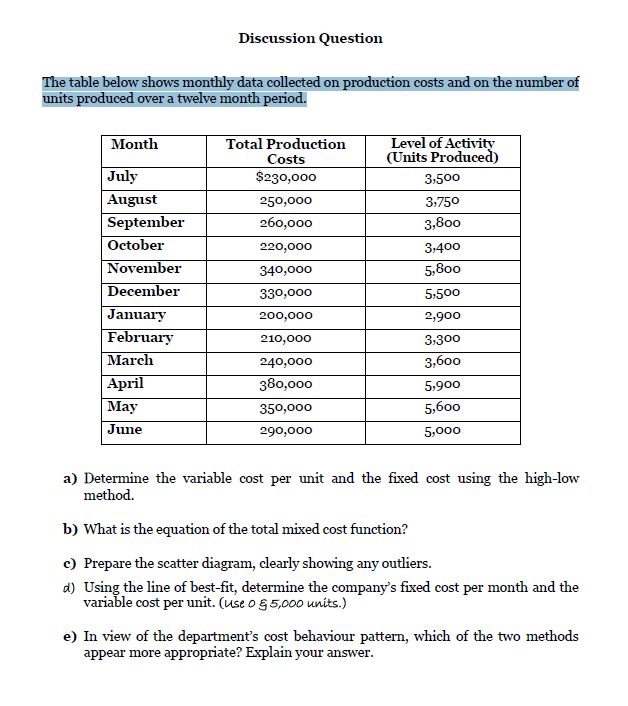
Discussion Question The table below shows monthly data collected on production costs and on the number of units produced over a twelve month period. Month
Step by Step Solution
There are 3 Steps involved in it
Step: 1

Get Instant Access to Expert-Tailored Solutions
See step-by-step solutions with expert insights and AI powered tools for academic success
Step: 2

Step: 3
Ace Your Homework with AI
Get the answers you need in no time with our AI-driven, step-by-step assistance
Get Started
Intermediate Accounting Reporting And Analysis, 2017 Update
Authors: James M. Wahlen, Jefferson P. Jones, Donald Pagach
2nd Edition
1337505625, 9781337505628