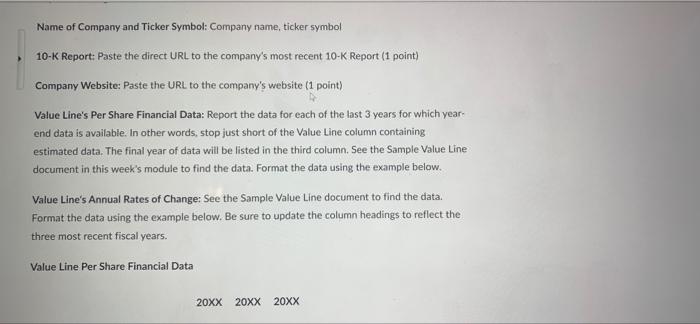
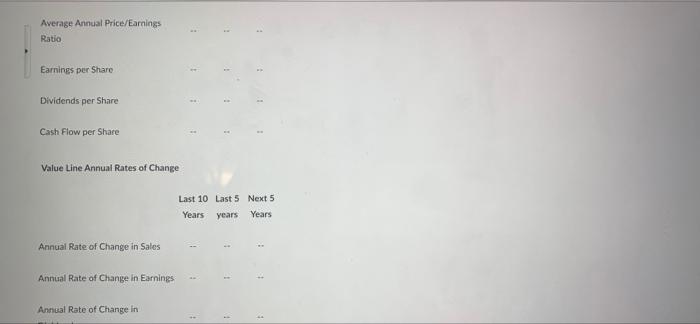
Discussions List View Topic Settings Help Search v Discussion 3 Available on Mar 21, 2022 12:01 AM Submission restricted before availability starts. Subscribe Overview: Annual Rates of Change and Key Company Risks This week you will examine the company's per share data and its annual growth rate percentages to get a sense of how well management has increased sales and controlled costs. If you wish to change companies, go to the discussion thread for Discussion 1 to reserve your new company making sure no one else has already reserved it. If you decide to stay with the same company you used for Discussion 1. there is no need to re-reserve it. Resources The ValueLine Research Center Go to the library website (https://library.ccls.edu) Click the "I Want to Find .dropdown menu and select Databases ESIE 41F Clear Then, click the "All Subjects dropdown menu and select Business Once the search has loaded, click "V" in the alphabet bar or search to find the Value Line Research Center Once you've opened the Value Line Research Center, enter the stock's ticker symbol in the search box in the upper-right of the screen and click Quote or select the correct stock from the hidden menu. Browse the research pages that follow Scroll to the bottom of the page to view the most recent Value Line Company Report Note: A sample Value Line document is posted in the Content area for this week. Also posted is a guide titled How to Read a Value Line Report. Pages 9-15 of the guide provide an excellent overview of how to read a Value Line company report - 10-K Report. Item 1A Your task is to prepare a report with the required information provided below. Use the same heading names in bold) before presenting the information as requested, Report Headings TG name ticker symbol Name of Company and Ticker Symbol: Company name, ticker symbol 10-K Report: Paste the direct URL to the company's most recent 10-K Report (1 point) Company Website: Paste the URL to the company's website (1 point) Value Line's Per Share Financial Data: Report the data for each of the last 3 years for which year end data is available. In other words, stop just short of the Value Line column containing estimated data. The final year of data will be listed in the third column. See the Sample Value Line document in this week's module to find the data. Format the data using the example below. Value Line's Annual Rates of Change: See the Sample Value Line document to find the data. Format the data using the example below. Be sure to update the column headings to reflect the three most recent fiscal years. Value Line Per Share Financial Data 20XX 20XX 20XX Average Annual Price/Earnings Ratio Earnings per Share - . Dividends per Share Cash Flow per Share Value Line Annual Rates of Change Last 10 Last 5 Next 5 Years years Years Annual Rate of Change in Sales Annual Rate of Change in Earnings Annual Rate of Change in Value Line Annual Rates of Change Last 10 Last 5 Next 5 Years years Years Annual Rate of Change in Sales Annual Rate of Change in Earnings Annual Rate of Change in Dividends Evaluation: Share what we learn from the data and information collected for this discussion What does the Valueline per share data tell us? What about the past and projected annual rates of change? Pay close attention to the most recent figures and the trends we see in the data, Identify and discuss any strengths and/or concerns. Sufficiently examining the data and information collected will likely require at least 250 words. Submit your report: Once you have completed the report. create a discussion post with the name of the company in the Subject line. Discussions List View Topic Settings Help Search v Discussion 3 Available on Mar 21, 2022 12:01 AM Submission restricted before availability starts. Subscribe Overview: Annual Rates of Change and Key Company Risks This week you will examine the company's per share data and its annual growth rate percentages to get a sense of how well management has increased sales and controlled costs. If you wish to change companies, go to the discussion thread for Discussion 1 to reserve your new company making sure no one else has already reserved it. If you decide to stay with the same company you used for Discussion 1. there is no need to re-reserve it. Resources The ValueLine Research Center Go to the library website (https://library.ccls.edu) Click the "I Want to Find .dropdown menu and select Databases ESIE 41F Clear Then, click the "All Subjects dropdown menu and select Business Once the search has loaded, click "V" in the alphabet bar or search to find the Value Line Research Center Once you've opened the Value Line Research Center, enter the stock's ticker symbol in the search box in the upper-right of the screen and click Quote or select the correct stock from the hidden menu. Browse the research pages that follow Scroll to the bottom of the page to view the most recent Value Line Company Report Note: A sample Value Line document is posted in the Content area for this week. Also posted is a guide titled How to Read a Value Line Report. Pages 9-15 of the guide provide an excellent overview of how to read a Value Line company report - 10-K Report. Item 1A Your task is to prepare a report with the required information provided below. Use the same heading names in bold) before presenting the information as requested, Report Headings TG name ticker symbol Name of Company and Ticker Symbol: Company name, ticker symbol 10-K Report: Paste the direct URL to the company's most recent 10-K Report (1 point) Company Website: Paste the URL to the company's website (1 point) Value Line's Per Share Financial Data: Report the data for each of the last 3 years for which year end data is available. In other words, stop just short of the Value Line column containing estimated data. The final year of data will be listed in the third column. See the Sample Value Line document in this week's module to find the data. Format the data using the example below. Value Line's Annual Rates of Change: See the Sample Value Line document to find the data. Format the data using the example below. Be sure to update the column headings to reflect the three most recent fiscal years. Value Line Per Share Financial Data 20XX 20XX 20XX Average Annual Price/Earnings Ratio Earnings per Share - . Dividends per Share Cash Flow per Share Value Line Annual Rates of Change Last 10 Last 5 Next 5 Years years Years Annual Rate of Change in Sales Annual Rate of Change in Earnings Annual Rate of Change in Value Line Annual Rates of Change Last 10 Last 5 Next 5 Years years Years Annual Rate of Change in Sales Annual Rate of Change in Earnings Annual Rate of Change in Dividends Evaluation: Share what we learn from the data and information collected for this discussion What does the Valueline per share data tell us? What about the past and projected annual rates of change? Pay close attention to the most recent figures and the trends we see in the data, Identify and discuss any strengths and/or concerns. Sufficiently examining the data and information collected will likely require at least 250 words. Submit your report: Once you have completed the report. create a discussion post with the name of the company in the Subject line