

Question
DLEON INC., PART II 4-26 FINANCIAL STATEMENTS AND TAXES Part I of this case, presented in Chapter 3, discussed the situation of DLeon Inc., a
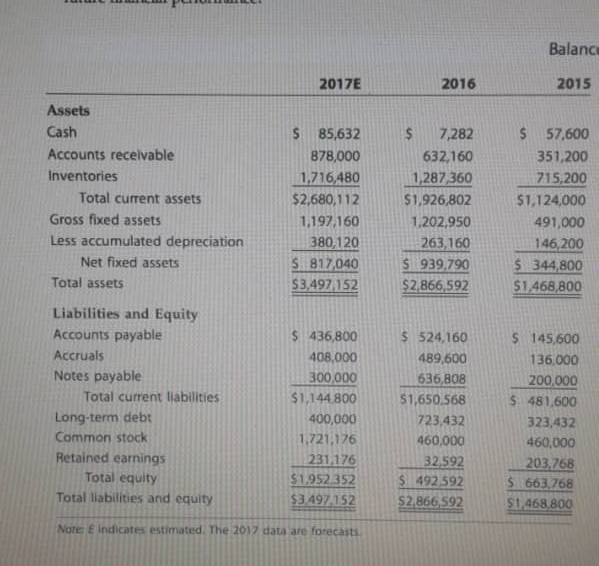
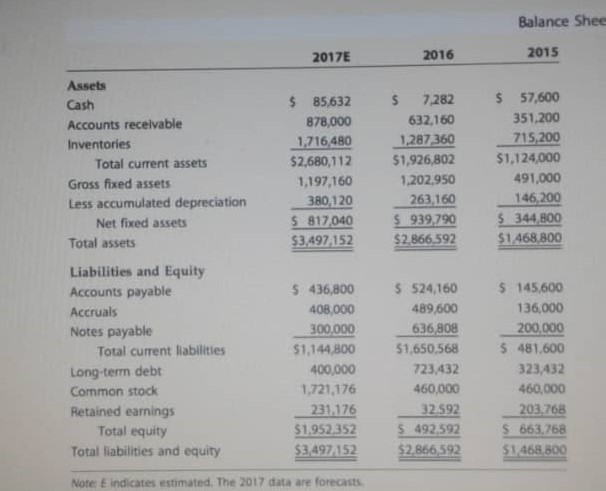
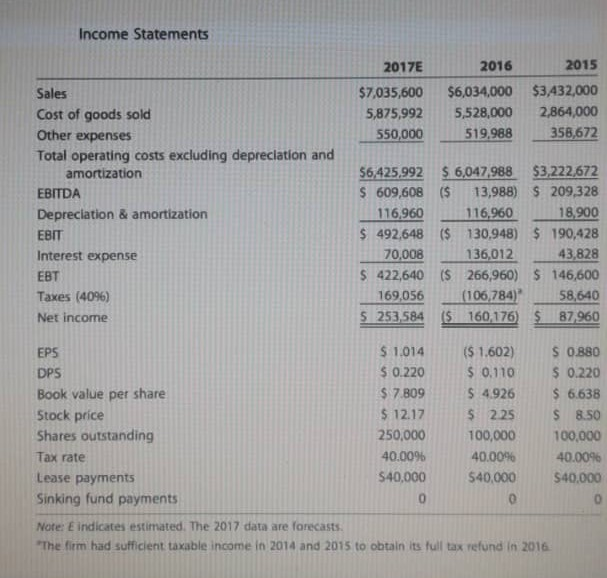
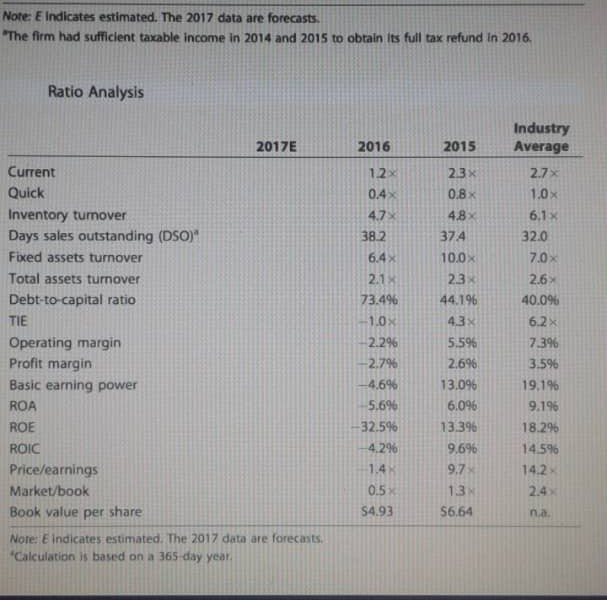
DLEON INC., PART II 4-26 FINANCIAL STATEMENTS AND TAXES Part I of this case, presented in Chapter 3, discussed the situation of DLeon Inc., a regional snack foods producer, after an expansion program. DLeon had increased plant capacity and undertaken a major marketing campaign in an attempt to go national. Thus far, sales have not been up to the forecasted level; costs have been higher than were projected; and a large loss occurred in 2016 rather than the expected profit. As a result, its managers, directors, and investors are concerned about the firms survival. Donna Jamison was brought in as assistant to Fred Campo, DLeons chairman, who had the task of getting the company back into a sound financial position. DLeons 2015 and 2016 balance sheets and income statements, together with projections for 2017, are given in Tables IC 4.1 and IC 4.2. In addition, Table IC 4.3 gives the companys 2015 and 2016 financial ratios, together with industry average data. The 2017 projected financial statement data represent Jamisons and Campos best guess for 2017 results, assuming that some new financing is arranged to get the company over the hump. Jamison examined monthly data for 2016 (not given in the case), and she detected an improving pattern during the year. Monthly sales were rising, costs were falling, and large losses in the early months had turned to a small profit by December. Thus, the annual data look somewhat worse than final monthly data. Also, it appears to be taking longer for the advertising program to get the message out, for the new sales offices to generate sales, and for the new manufacturing facilities to operate efficiently. In other words, the lags between spending money and deriving benefits were longer than DLeons managers had anticipated. For these reasons, Jamison and Campo see hope for the companyprovided it can survive in the short run. Jamison must prepare an analysis of where the company is now, what it must do to regain its financial health, and what actions should be taken. Your assignment is to help her answer the following questions. Provide clear explanations, not yes or no answers.
a. Why are ratios useful? What are the five major categories of ratios?
b. Calculate DLeons 2017 current and quick ratios based on the projected balance sheet and income statement data. What can you say about the companys liquidity positions in 2015, in 2016, and as projected for 2017? We often think of ratios as being useful (1) to managers to help run the business, (2) to bankers for credit analysis, and (3) to stockholders for stock valuation. Would these different types of analysts have an equal interest in the companys liquidity ratios? Explain your answer.
c. Calculate the 2017 inventory turnover, days sales outstanding (DSO), fixed assets turnover, and total assets turnover. How does DLeons utilization of assets stack up against other firms in the industry?
d. Calculate the 2017 debt-to-capital and times-interest-earned ratios. How does DLeon compare with the industry with respect to financial leverage? What can you conclude from these ratios?
e. Calculate the 2017 operating margin, profit margin, basic earning power (BEP), return on assets (ROA), return on equity (ROE), and return on invested capital (ROIC). What can you say about these ratios?
f. Calculate the 2017 price/earnings ratio and market/book ratio. Do these ratios indicate that investors are expected to have a high or low opinion of the company?
g. Use the DuPont equation to provide a summary and overview of DLeons financial condition as projected for 2017. What are the firms major strengths and weaknesses?
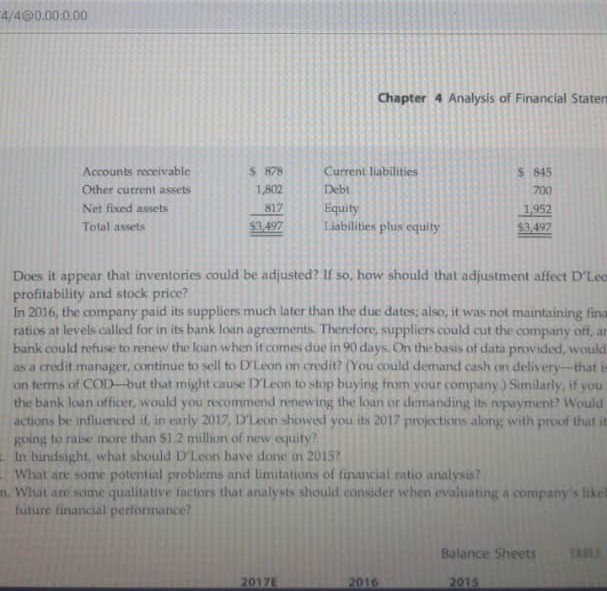
h. Use the following simplified 2017 balance sheet to show, in general terms, how an improvement in the DSO would tend to affect the stock price. For example, if the company could improve its collection procedures and thereby lower its DSO from 45.6 days to the 32-day industry average without affecting sales, how would that change ripple through the financial statements (shown in thousands below) and influence the stock price?
i. Does it appear that inventories could be adjusted? If so, how should that adjustment affect DLeons profitability and stock price?
j. In 2016, the company paid its suppliers much later than the due dates; also, it was not maintaining financial ratios at levels called for in its bank loan agreements. Therefore, suppliers could cut the company off, and its bank could refuse to renew the loan when it comes due in 90 days. On the basis of data provided, would you, as a credit manager, continue to sell to DLeon on credit? (You could demand cash on deliverythat is, sell on terms of CODbut that might cause DLeon to stop buying from your company.) Similarly, if you were the bank loan officer, would you recommend renewing the loan or demanding its repayment? Would your actions be influenced if, in early 2017, DLeon showed you its 2017 projections along with proof that it was going to raise more than $1.2 million of new equity?
k. In hindsight, what should DLeon have done in 2015? l. What are some potential problems and limitations of financial ratio analysis? m. What are some qualitative factors that analysts should consider when evaluating a companys likely future financial performance?
l. What are some potential problems and limitations of financial ratio analysis?
m. What are some qualitative factors that analysts should consider when evaluating a companys likely future financial performance?
Step by Step Solution
There are 3 Steps involved in it
Step: 1

Get Instant Access to Expert-Tailored Solutions
See step-by-step solutions with expert insights and AI powered tools for academic success
Step: 2

Step: 3
Ace Your Homework with AI
Get the answers you need in no time with our AI-driven, step-by-step assistance
Get Started
Privacy In Practice Establish And Operationalize A Holistic Data Privacy Program Security Audit Leadership Series
Authors: Alan Tang
1st Edition
1032125470, 978-1032125473