

Question: Do a Sensitivity Analysis on the following DCF Year 1 Year 2 Year 3 Now 04 Account Q1 Q2 Q3 04 Q1 Q2 Q3 04
Do a Sensitivity Analysis on the following DCF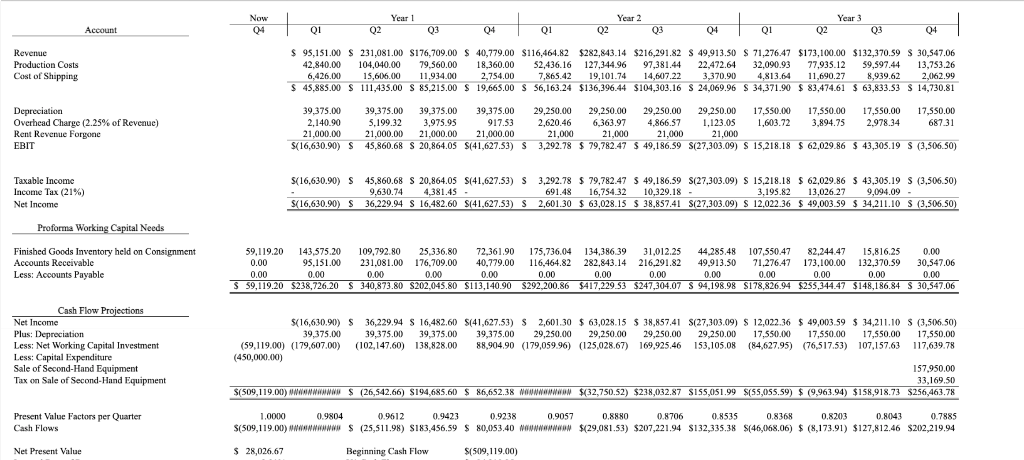
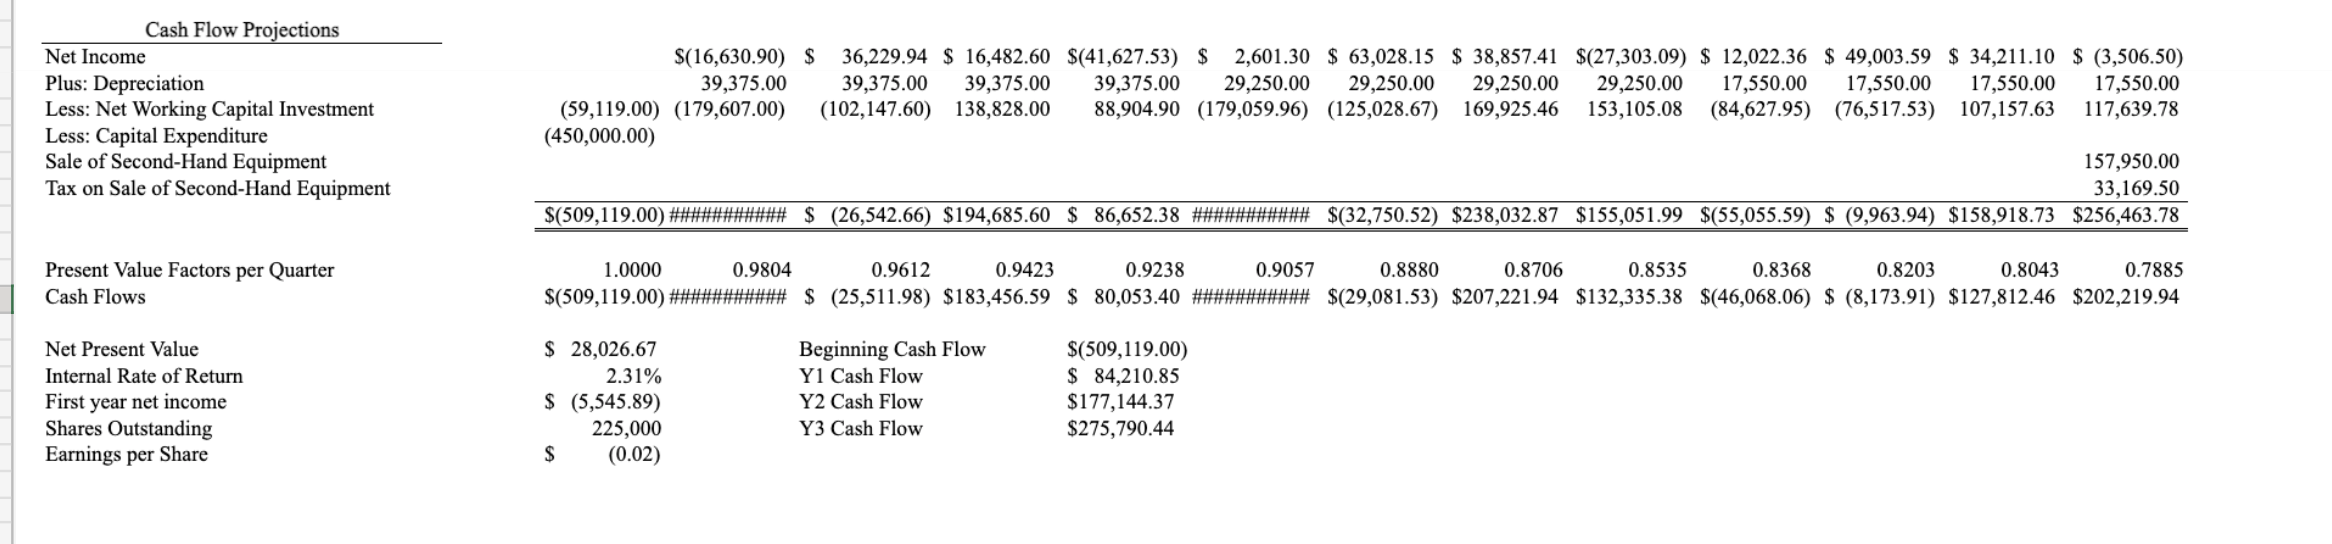
Year 1 Year 2 Year 3 Now 04 Account Q1 Q2 Q3 04 Q1 Q2 Q3 04 Q1 Q2 Q3 04 Revenue Production Costs Cost of Shipping $ 95,151.00 S 231,081.00 $176,709.00 $ 40,779.00 $116,464.82 $282,843.14 $216,291.82 $ 49,913.50 $ 71,276.47 $173,100.00 $132,370.59 $ 30,547.06 42.840.00 104,040.00 79,560.00 18,360.00 52,436.16 127,344.96 97,381.44 22,472 64 32,090.93 77,935.12 59,597.44 13,753.26 6,426.00 15,616.00 11,934.00 2,754.00 7,865.42 19,101.74 14,607.22 3,370.90 4.813.64 11,690.27 8,939.62 2,062.99 $ 45,885.00 $ 111,435.00 S 85.215.00 $ 19,665.00 $ 56,163.24 $136,396.44 $104,303.16 $ 24,069.96 $ 34,371.90 $ 83,474.61 $ 63,833.53 $ 14,730.81 Depreciation Overhead Charge (2.25% of Revenue) Rent Revenue Forgone EBIT 39,375.00 39,375,00 39.375,00 39,375.00 29,250.00 29,250.00 29,250.00 29,250.00 17.550.00 17,550.00 5.199.32 17,550.00 17.850.00 2,140.90 3,975.95 917.53 2.620.46 6,363.97 4,866.57 1.123.05 1,603.72 3,894.75 2,978.34 687.31 21,000.00 21,000.00 21,000.00 21,000,00 21,000 21,000 21,000 21,000 S(16,630.90) $ 45,860.68 S 20,864.05 $(41,627.53) S 3,292.78 $ 79,782.47 $ 49,186.59 $(27,303.09) S 15,218.18 $ 62,029.86 $ 43,305.19 S (3,506.50) ) $ $ Taxable Income Income Tax (21%) Net Income $(16,630.90) S 45.860.68 S 20.864.05 S(41,627.53) S 3,292.78 $ 79,782.47 $ 49,186.59 S(27,303.09) S 15,218.18 $ 62,029.86 $ 43,305.19 S (3,506.50) 9,630,74 4,381.45 - 691.48 16,754.32 10,329.18 - 3,195.82 13,026 27 9,094.09 - S(16.630.90) S ) S 36.229.94 S 16,482.60 $(41,627.53) S 2,601.30 $ 63,028.15 S 38,857.41 $(27,303.09) S 12.022.36 $ 49,003.59 $ 34,211.10 S (3,506.50) Proforma Working Capital Needs Finished Goods Inventory held on Consignment Accounts Receivable Less: Accounts Payable 59,119.20 143,575.20 109,792.80 25,336.80 72,361.90 175,736.04 134,386,39 31,012.25 44.285.48 107,550,47 82,244.47 15,816.25 0.00 0.00 95.151.00 231,081.00 176,709.00 40,779.00 116,464.82 282,843.14 216,291.82 49,913.50 71,276.47 173,100.00 132.370.59 30.547,06 0.00 0.00 0.00 0.00 0.00 0.00 0.00 0.00 0.00 0.00 0.00 0.00 0.00 $ 59,119.20 $238,726.20 $ 340,873.80 S202,045.80 $113,140.90 $292,200.86 $417,229.53 $247,304.07 S 94,198.98 $178,826.94 $255,344.47 $148,186.84 S 30,547.06 Cash Flow Projections Net Income Plus: Depreciation Less: Net Working Capital Investment Less: Capital Expenditure Sale of Second-Hand Equipment Tax on Sale of Second-Hand Equipment $(16,630.90) S 36,229.94 S 16,482.60 $(41,627.53) $ 2,601.30 $ 63,028.15 $ 38,857,41 S(27,303.09) S 12,022.36 $ 49,003.59 $ 34,211.10 $ (3,506,50) 39,375.00 39,375.00 39,375.00 39,375.00 29,250.00 29,250.00 29,250.00 29,250.00 17,550.000 17,550.00 17,550.00 17,550.00 (59,119.00) (1 79,607.00) (102,147.60) 138,828.00 88,904.90 (179,059.96) (125,028.67) 169,925.46 153,105.08 (84,627.95) (76,517.53) 107,157.63 117,639.78 (450,000.00) 157.950.00 33,169.50 $(509,119.00) WWWWWWWWWW S (26,542.66) S194,685.60 $ 86,652.38 Nawwwwwww $(32,750.52) $238,032.87 $155,051.99 $(55,055.59) $ 9,963.94) $158,918.73 $256,463.78 Present Value Factors per Quarter Cash Flows 1.0000 0.9804 0.9612 0.9423 0.9238 0.9057 0.8880 0.8706 0.8535 0.8368 0.8203 0.8043 0.7885 $(509,119.00) WWWWWWWWWW S (25,511.98) $183,456.59 $ 80,053.40 NOWWWWWW $(29,081.53) $207,221.94 $132,335.38 $(46,068.06) $ (8,173.91) $127,812.46 $202,219.94 Net Present Value $ 28,026,67 Beginning Cash Flow $(509,119.00) Cash Flow Projections Net Income Plus: Depreciation Less: Net Working Capital Investment Less: Capital Expenditure Sale of Second-Hand Equipment Tax on Sale of Second-Hand Equipment $(16,630.90) $ 36,229.94 $ 16,482.60 $(41,627.53) $ 2,601.30 $ 63,028.15 $ 38,857.41 $(27,303.09) $ 12,022.36 $ 49,003.59 $ 34,211.10 $ (3,506.50) 39,375.00 39,375.00 39,375.00 39,375.00 29,250.00 29,250.00 29,250.00 29,250.00 17,550.00 17,550.00 17,550.00 17,550.00 (59,119.00) (179,607.00) (102,147.60) 138,828.00 88,904.90 (179,059.96) (125,028.67) 169,925.46 153,105.08 (84,627.95) (76,517.53) 107,157.63 117,639.78 (450,000.00) 157,950.00 33,169.50 $(509,119.00) ########### $ (26,542.66) $194,685.60 $ 86,652.38 ########## $(32,750.52) $238,032.87 $155,051.99 $(55,055.59) $ (9,963.94) $158,918.73 $256,463.78 Present Value Factors per Quarter Cash Flows 1.0000 0.9804 0.9612 0.9423 0.9238 0.9057 0.8880 0.8706 0.8535 0.8368 0.8203 0.8043 0.7885 $(509,119.00) ########### $ (25,511.98) $183,456.59 $ 80,053.40 ########### $(29,081.53) $207,221.94 $132,335.38 $(46,068.06) $ (8,173.91) $127,812.46 $202,219.94 Net Present Value Internal Rate of Return First year net income Shares Outstanding Earnings per Share $ 28,026.67 2.31% $ (5,545.89) 225,000 $ (0.02) Beginning Cash Flow Y1 Cash Flow Y2 Cash Flow Y3 Cash Flow $(509,119.00) $ 84,210.85 $177,144.37 $275,790.44 Year 1 Year 2 Year 3 Now 04 Account Q1 Q2 Q3 04 Q1 Q2 Q3 04 Q1 Q2 Q3 04 Revenue Production Costs Cost of Shipping $ 95,151.00 S 231,081.00 $176,709.00 $ 40,779.00 $116,464.82 $282,843.14 $216,291.82 $ 49,913.50 $ 71,276.47 $173,100.00 $132,370.59 $ 30,547.06 42.840.00 104,040.00 79,560.00 18,360.00 52,436.16 127,344.96 97,381.44 22,472 64 32,090.93 77,935.12 59,597.44 13,753.26 6,426.00 15,616.00 11,934.00 2,754.00 7,865.42 19,101.74 14,607.22 3,370.90 4.813.64 11,690.27 8,939.62 2,062.99 $ 45,885.00 $ 111,435.00 S 85.215.00 $ 19,665.00 $ 56,163.24 $136,396.44 $104,303.16 $ 24,069.96 $ 34,371.90 $ 83,474.61 $ 63,833.53 $ 14,730.81 Depreciation Overhead Charge (2.25% of Revenue) Rent Revenue Forgone EBIT 39,375.00 39,375,00 39.375,00 39,375.00 29,250.00 29,250.00 29,250.00 29,250.00 17.550.00 17,550.00 5.199.32 17,550.00 17.850.00 2,140.90 3,975.95 917.53 2.620.46 6,363.97 4,866.57 1.123.05 1,603.72 3,894.75 2,978.34 687.31 21,000.00 21,000.00 21,000.00 21,000,00 21,000 21,000 21,000 21,000 S(16,630.90) $ 45,860.68 S 20,864.05 $(41,627.53) S 3,292.78 $ 79,782.47 $ 49,186.59 $(27,303.09) S 15,218.18 $ 62,029.86 $ 43,305.19 S (3,506.50) ) $ $ Taxable Income Income Tax (21%) Net Income $(16,630.90) S 45.860.68 S 20.864.05 S(41,627.53) S 3,292.78 $ 79,782.47 $ 49,186.59 S(27,303.09) S 15,218.18 $ 62,029.86 $ 43,305.19 S (3,506.50) 9,630,74 4,381.45 - 691.48 16,754.32 10,329.18 - 3,195.82 13,026 27 9,094.09 - S(16.630.90) S ) S 36.229.94 S 16,482.60 $(41,627.53) S 2,601.30 $ 63,028.15 S 38,857.41 $(27,303.09) S 12.022.36 $ 49,003.59 $ 34,211.10 S (3,506.50) Proforma Working Capital Needs Finished Goods Inventory held on Consignment Accounts Receivable Less: Accounts Payable 59,119.20 143,575.20 109,792.80 25,336.80 72,361.90 175,736.04 134,386,39 31,012.25 44.285.48 107,550,47 82,244.47 15,816.25 0.00 0.00 95.151.00 231,081.00 176,709.00 40,779.00 116,464.82 282,843.14 216,291.82 49,913.50 71,276.47 173,100.00 132.370.59 30.547,06 0.00 0.00 0.00 0.00 0.00 0.00 0.00 0.00 0.00 0.00 0.00 0.00 0.00 $ 59,119.20 $238,726.20 $ 340,873.80 S202,045.80 $113,140.90 $292,200.86 $417,229.53 $247,304.07 S 94,198.98 $178,826.94 $255,344.47 $148,186.84 S 30,547.06 Cash Flow Projections Net Income Plus: Depreciation Less: Net Working Capital Investment Less: Capital Expenditure Sale of Second-Hand Equipment Tax on Sale of Second-Hand Equipment $(16,630.90) S 36,229.94 S 16,482.60 $(41,627.53) $ 2,601.30 $ 63,028.15 $ 38,857,41 S(27,303.09) S 12,022.36 $ 49,003.59 $ 34,211.10 $ (3,506,50) 39,375.00 39,375.00 39,375.00 39,375.00 29,250.00 29,250.00 29,250.00 29,250.00 17,550.000 17,550.00 17,550.00 17,550.00 (59,119.00) (1 79,607.00) (102,147.60) 138,828.00 88,904.90 (179,059.96) (125,028.67) 169,925.46 153,105.08 (84,627.95) (76,517.53) 107,157.63 117,639.78 (450,000.00) 157.950.00 33,169.50 $(509,119.00) WWWWWWWWWW S (26,542.66) S194,685.60 $ 86,652.38 Nawwwwwww $(32,750.52) $238,032.87 $155,051.99 $(55,055.59) $ 9,963.94) $158,918.73 $256,463.78 Present Value Factors per Quarter Cash Flows 1.0000 0.9804 0.9612 0.9423 0.9238 0.9057 0.8880 0.8706 0.8535 0.8368 0.8203 0.8043 0.7885 $(509,119.00) WWWWWWWWWW S (25,511.98) $183,456.59 $ 80,053.40 NOWWWWWW $(29,081.53) $207,221.94 $132,335.38 $(46,068.06) $ (8,173.91) $127,812.46 $202,219.94 Net Present Value $ 28,026,67 Beginning Cash Flow $(509,119.00) Cash Flow Projections Net Income Plus: Depreciation Less: Net Working Capital Investment Less: Capital Expenditure Sale of Second-Hand Equipment Tax on Sale of Second-Hand Equipment $(16,630.90) $ 36,229.94 $ 16,482.60 $(41,627.53) $ 2,601.30 $ 63,028.15 $ 38,857.41 $(27,303.09) $ 12,022.36 $ 49,003.59 $ 34,211.10 $ (3,506.50) 39,375.00 39,375.00 39,375.00 39,375.00 29,250.00 29,250.00 29,250.00 29,250.00 17,550.00 17,550.00 17,550.00 17,550.00 (59,119.00) (179,607.00) (102,147.60) 138,828.00 88,904.90 (179,059.96) (125,028.67) 169,925.46 153,105.08 (84,627.95) (76,517.53) 107,157.63 117,639.78 (450,000.00) 157,950.00 33,169.50 $(509,119.00) ########### $ (26,542.66) $194,685.60 $ 86,652.38 ########## $(32,750.52) $238,032.87 $155,051.99 $(55,055.59) $ (9,963.94) $158,918.73 $256,463.78 Present Value Factors per Quarter Cash Flows 1.0000 0.9804 0.9612 0.9423 0.9238 0.9057 0.8880 0.8706 0.8535 0.8368 0.8203 0.8043 0.7885 $(509,119.00) ########### $ (25,511.98) $183,456.59 $ 80,053.40 ########### $(29,081.53) $207,221.94 $132,335.38 $(46,068.06) $ (8,173.91) $127,812.46 $202,219.94 Net Present Value Internal Rate of Return First year net income Shares Outstanding Earnings per Share $ 28,026.67 2.31% $ (5,545.89) 225,000 $ (0.02) Beginning Cash Flow Y1 Cash Flow Y2 Cash Flow Y3 Cash Flow $(509,119.00) $ 84,210.85 $177,144.37 $275,790.44
Step by Step Solution
There are 3 Steps involved in it

Get step-by-step solutions from verified subject matter experts