

Question
Do as a Jackson Network! M/M/c Queueing 1. [20 points] For each of the five stations, compute the local utilization (i.e. ), the average waiting
Do as a Jackson Network! M/M/c Queueing
1. [20 points] For each of the five stations, compute the local utilization (i.e. ), the average waiting time (W), and the average number of patients in the station (L). For this question compute the results by hand i.e., dont use mmc.exe or similar program. Attach your computations, and make sure that they are legible
2. [10 points] Build a spreadsheet to make the computations of the previous question and check your results. Make sure to attach the spreadsheet.
3. [5 points] Use the spreadsheet to compute the average waiting time (W) and average number of patients (L) for the entire clinic.
4. [15 points] Suppose that the clinic administration wants to decrease the patients average waiting time by 20%. If you are only allowed to make such improvement by increasing the capacity (i.e. service rate) in one of the five stations; (i) what station would you choose?, (ii) in what percentage would you increase the capacity of the station you chose?, and (iii) what assumption(s) did you need to make to solve this question? (Hint: use the spreadsheet you built for the previous questions, and use the Goal Seek functionality in Excel)
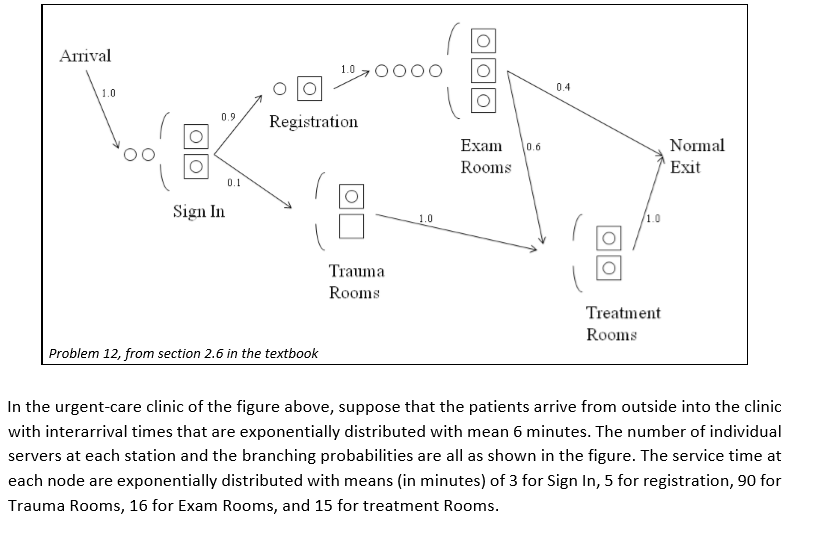
Arrival >0000 0.4 0.9 Registration Normal Exit Exam 0,6 Rooms Sign In 1.0 Trauma Rooms Treatment Rooms Problem 12, from section 2.6 in the textbook In the urgent-care clinic of the figure above, suppose that the patients arrive from outside into the clinic with interarrival times that are exponentially distributed with mean 6 minutes. The number of individual servers at each station and the branching probabilities are all as shown in the figure. The service time at each node are exponentially distributed with means (in minutes) of 3 for Sign In, 5 for registration, 90 for Trauma Rooms, 16 for Exam Rooms, and 15 for treatment Rooms Arrival >0000 0.4 0.9 Registration Normal Exit Exam 0,6 Rooms Sign In 1.0 Trauma Rooms Treatment Rooms Problem 12, from section 2.6 in the textbook In the urgent-care clinic of the figure above, suppose that the patients arrive from outside into the clinic with interarrival times that are exponentially distributed with mean 6 minutes. The number of individual servers at each station and the branching probabilities are all as shown in the figure. The service time at each node are exponentially distributed with means (in minutes) of 3 for Sign In, 5 for registration, 90 for Trauma Rooms, 16 for Exam Rooms, and 15 for treatment RoomsStep by Step Solution
There are 3 Steps involved in it
Step: 1

Get Instant Access to Expert-Tailored Solutions
See step-by-step solutions with expert insights and AI powered tools for academic success
Step: 2

Step: 3
Ace Your Homework with AI
Get the answers you need in no time with our AI-driven, step-by-step assistance
Get Started
Logidata+ Deductive Databases With Complex Objects Lncs 701
Authors: Paolo Atzeni
1st Edition
354056974X, 978-3540569749