

Answered step by step
Verified Expert Solution
Question
1 Approved Answer
do in excel and show you got the numbers Consider a system where the inventory level follows the pattern of the probabilistic order-level inventory system
do in excel and show you got the numbers 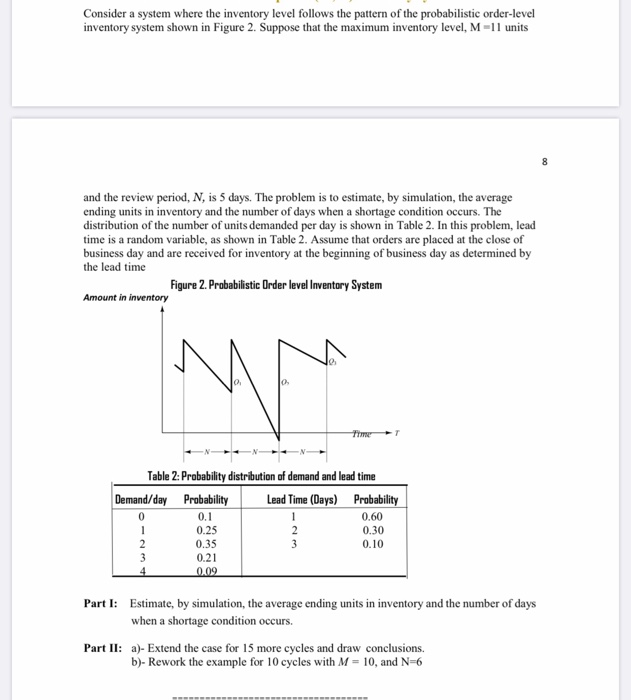
Consider a system where the inventory level follows the pattern of the probabilistic order-level inventory system shown in Figure 2. Suppose that the maximum inventory level, M-11 units 8 and the review period, N, is 5 days. The problem is to estimate, by simulation, the average ending units in inventory and the number of days when a shortage condition occurs. The distribution of the number of units demanded per day is shown in Table 2. In this problem, lead time is a random variable, as shown in Table 2. Assume that orders are placed at the close of business day and are received for inventory at the beginning of business day as determined by the lead time Figure 2. Probabilistic Order level Inventory System Amount in inventory 7 Table 2: Probability distribution of demand and lead time Demand/day Probability Lead Time (Days) Probability 0.1 0.60 0.25 2 0.30 0.35 0.10 3 0.21 0.09 1 2 Part I: Estimate, by simulation, the average ending units in inventory and the number of days when a shortage condition occurs. Part II: a)- Extend the case for 15 more cycles and draw conclusions. b)- Rework the example for 10 cycles with M = 10, and N=6 Consider a system where the inventory level follows the pattern of the probabilistic order-level inventory system shown in Figure 2. Suppose that the maximum inventory level, M-11 units 8 and the review period, N, is 5 days. The problem is to estimate, by simulation, the average ending units in inventory and the number of days when a shortage condition occurs. The distribution of the number of units demanded per day is shown in Table 2. In this problem, lead time is a random variable, as shown in Table 2. Assume that orders are placed at the close of business day and are received for inventory at the beginning of business day as determined by the lead time Figure 2. Probabilistic Order level Inventory System Amount in inventory 7 Table 2: Probability distribution of demand and lead time Demand/day Probability Lead Time (Days) Probability 0.1 0.60 0.25 2 0.30 0.35 0.10 3 0.21 0.09 1 2 Part I: Estimate, by simulation, the average ending units in inventory and the number of days when a shortage condition occurs. Part II: a)- Extend the case for 15 more cycles and draw conclusions. b)- Rework the example for 10 cycles with M = 10, and N=6 Step by Step Solution
There are 3 Steps involved in it
Step: 1

Get Instant Access to Expert-Tailored Solutions
See step-by-step solutions with expert insights and AI powered tools for academic success
Step: 2

Step: 3
Ace Your Homework with AI
Get the answers you need in no time with our AI-driven, step-by-step assistance
Get Started
A Guide To The National Initiative For Cybersecurity Education NICE Cybersecurity Workforce Framework 2.0 Internal Audit And IT Audit
Authors: Dan Shoemaker, Anne Kohnke, Ken Sigler
1st Edition
0367658623, 978-0367658625