Answered step by step
Verified Expert Solution
Link Copied!

Question

1 Approved Answer

DO IN MATLAB 2. Defining signals (10 points) a. Create a function to generate a time array Function name: 't_array Inputs: start time, end time,

DO IN MATLAB
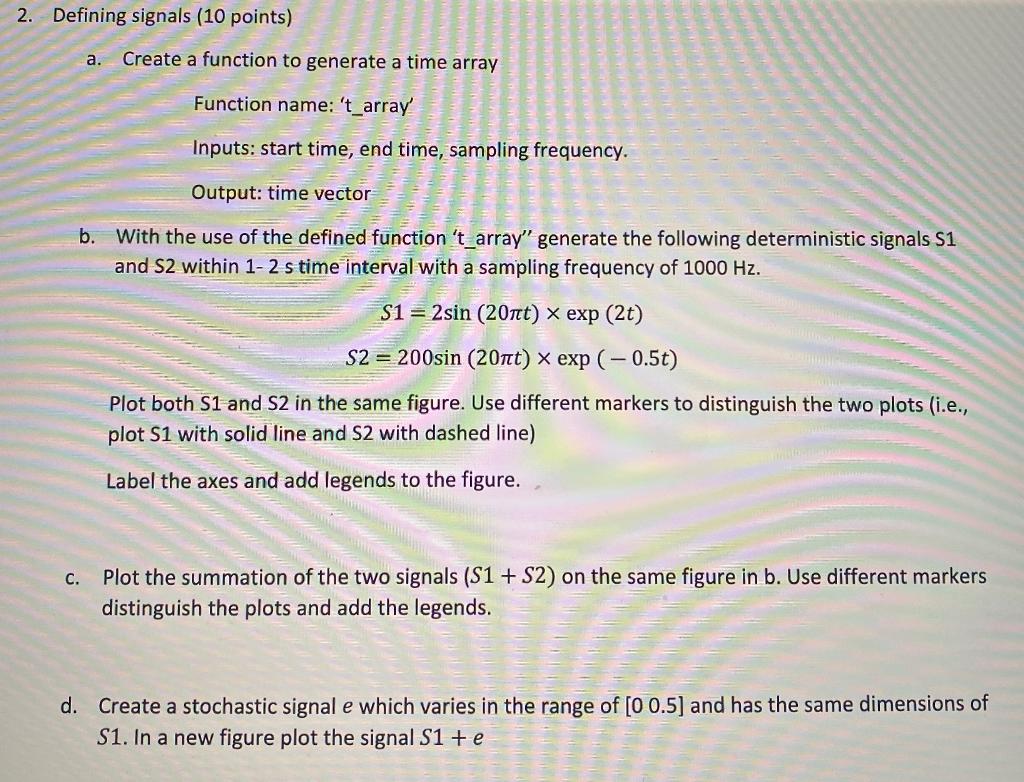
image text in transcribed

2. Defining signals (10 points) a. Create a function to generate a time array Function name: 't_array Inputs: start time, end time, sampling frequency. Output: time vector b. With the use of the defined function 't_array" generate the following deterministic signals S1 and S2 within 1-2 s time interval with a sampling frequency of 1000 Hz. S1 = 2sin (20nt) x exp (2t) S2 = 200sin (20ft) x exp(-0.5t) Plot both S1 and S2 in the same figure. Use different markers to distinguish the two plots (i.e., plot S1 with solid line and S2 with dashed line) Label the axes and add legends to the figure. C. Plot the summation of the two signals (S1 + S2) on the same figure in b. Use different markers distinguish the plots and add the legends. d. Create a stochastic signal e which varies in the range of [0 0.5] and has the same dimensions of S1. In a new figure plot the signal S1 +e

Step by Step Solution

There are 3 Steps involved in it

Step: 1

blur-text-image

Get Instant Access to Expert-Tailored Solutions

See step-by-step solutions with expert insights and AI powered tools for academic success

Step: 2

blur-text-image

Step: 3

blur-text-image

Ace Your Homework with AI

Get the answers you need in no time with our AI-driven, step-by-step assistance

Get Started

Recommended Textbook for

Data And Databases

Authors: Jeff Mapua

1st Edition

1978502257, 978-1978502253

More Books

Students also viewed these Databases questions