Do it in excel show steps please
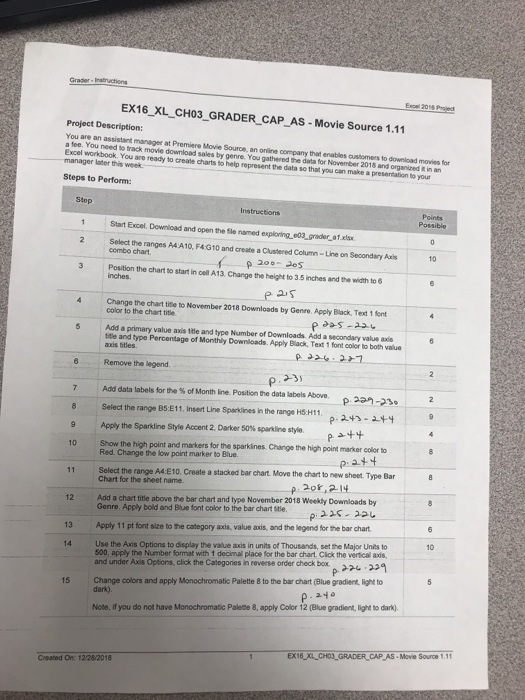
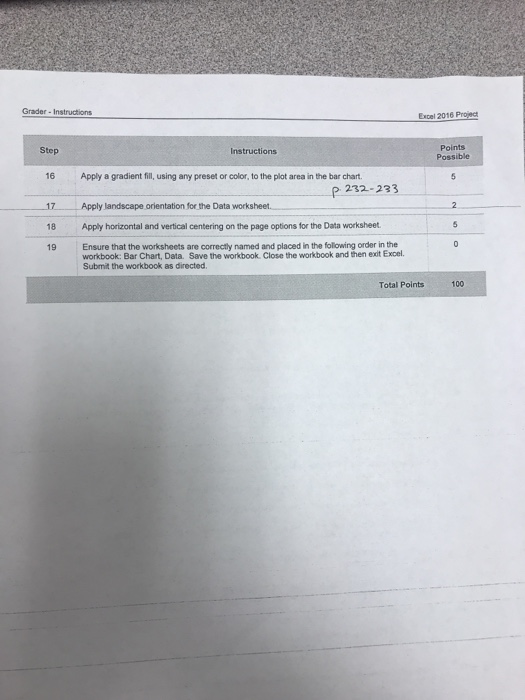
Grader Inatructions Excel 205 Proect EX16_XL_CH03_GRADER_CAP_AS-Movie Source 1.11 Project Description You are an assistant manager at Premiere Movie Source, an oniline company the atee. You need totrack move download sales by genre You gatheredte data Excel workbook. You are ready to create charts to help represent the data so that you can make a presertation to your that enables customers to download movies for for November 2018 and organized-in an manager later this Steps to Porform: Step Points Start Excel. Download and open the fle named exploring e03 graderatxisx Select the ranges A4 A10, F4G10 and create a Clustered Column-Line on Secondary Axis combo chart 10 200-Jos 3 Position the chart to start in cell A13. Change the height to 3.5 inches and the with to inches e as 4 Change the chart tisle to November 2018 Downloads by Genre. Apply Black, Text 1 font color to the chart title Add a primary value axis ttle and type Number of Downloads. Add a secondary value axis tite and type Percentage of Monthly Downloads. Apply Black, Text 1 font coler to both value axis ttles. 6 Remove the legend 7 Add data labels for the % of Month line. Position the data labels Above. 8 Select the range BS:E11. Insert Line Spaktines in the rangs HiSH1. p- 9 , p>++ 10 Show the high point and markers for the sparklnes Change the high point marker color to Apply the Sparkine Style Accent 2, Darker 50% spakine style Red. Change the low point marker to Blue. Select the range A4. E10. Create a stacked bar chart Move the chart to new sheet. Type Bar Chart for the sheet name. 12 Add a chart title above the bar chart and type November 2018 Weekly Downloads by Genre. Apply bold and Blue font color to the bar chart ste Apply 11 pt font size to the category axis, value axis, and the legend for the bar chart 14 Use the Axis Options to display the value axis in units of Thousands, set the Major Units to 13 10 500, apply the Number format with 1 decimal place for the bar chart Click the verical axis, and under Axis Options, click the Categories in reverse order check box. 15 Change colors and apply Monochromatic Palette8 to the bar chart (Blue gradient, light to dark). Note, if you do not have Monochromatic Palete 8, apply Color 12 (Blue gradient, light to dark). EX16 XL CHO3 GRADER CAP AS-Movie Source 1.1 On: 12/28/2018 Grader- Instructions Excel 2016 Project Points Possible Step Instructions 16 Apply a gradient fill, using any preset or color, to the plot area in the bar chart. P 232-233 Apply landscape orientation for the Data worksheet.2 18 Apply horizontal and vertical centering on the page options for the Data worksheet 19 Ensure that the worksheets are correctly named and placed in the folowing order in the workbook: Bar Chart, Data. Save the workbook. Close the workbook and then exit Excel Submit the workbook as directed Total Points 100 Grader Inatructions Excel 205 Proect EX16_XL_CH03_GRADER_CAP_AS-Movie Source 1.11 Project Description You are an assistant manager at Premiere Movie Source, an oniline company the atee. You need totrack move download sales by genre You gatheredte data Excel workbook. You are ready to create charts to help represent the data so that you can make a presertation to your that enables customers to download movies for for November 2018 and organized-in an manager later this Steps to Porform: Step Points Start Excel. Download and open the fle named exploring e03 graderatxisx Select the ranges A4 A10, F4G10 and create a Clustered Column-Line on Secondary Axis combo chart 10 200-Jos 3 Position the chart to start in cell A13. Change the height to 3.5 inches and the with to inches e as 4 Change the chart tisle to November 2018 Downloads by Genre. Apply Black, Text 1 font color to the chart title Add a primary value axis ttle and type Number of Downloads. Add a secondary value axis tite and type Percentage of Monthly Downloads. Apply Black, Text 1 font coler to both value axis ttles. 6 Remove the legend 7 Add data labels for the % of Month line. Position the data labels Above. 8 Select the range BS:E11. Insert Line Spaktines in the rangs HiSH1. p- 9 , p>++ 10 Show the high point and markers for the sparklnes Change the high point marker color to Apply the Sparkine Style Accent 2, Darker 50% spakine style Red. Change the low point marker to Blue. Select the range A4. E10. Create a stacked bar chart Move the chart to new sheet. Type Bar Chart for the sheet name. 12 Add a chart title above the bar chart and type November 2018 Weekly Downloads by Genre. Apply bold and Blue font color to the bar chart ste Apply 11 pt font size to the category axis, value axis, and the legend for the bar chart 14 Use the Axis Options to display the value axis in units of Thousands, set the Major Units to 13 10 500, apply the Number format with 1 decimal place for the bar chart Click the verical axis, and under Axis Options, click the Categories in reverse order check box. 15 Change colors and apply Monochromatic Palette8 to the bar chart (Blue gradient, light to dark). Note, if you do not have Monochromatic Palete 8, apply Color 12 (Blue gradient, light to dark). EX16 XL CHO3 GRADER CAP AS-Movie Source 1.1 On: 12/28/2018 Grader- Instructions Excel 2016 Project Points Possible Step Instructions 16 Apply a gradient fill, using any preset or color, to the plot area in the bar chart. P 232-233 Apply landscape orientation for the Data worksheet.2 18 Apply horizontal and vertical centering on the page options for the Data worksheet 19 Ensure that the worksheets are correctly named and placed in the folowing order in the workbook: Bar Chart, Data. Save the workbook. Close the workbook and then exit Excel Submit the workbook as directed Total Points 100