

Answered step by step
Verified Expert Solution
Question
1 Approved Answer
DO NOT ANSWER #1 II. Year 2018 2019 Historical Inflation and Interest Data, the US and the UK Interest Rate Spot EXR US UK 5%
DO NOT ANSWER #1 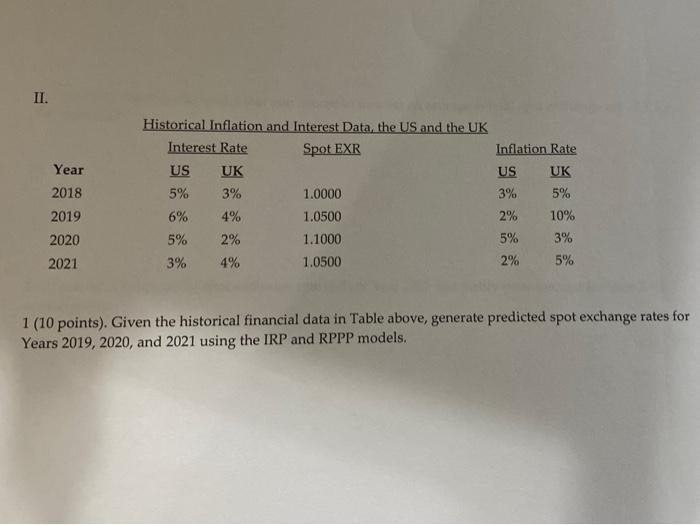
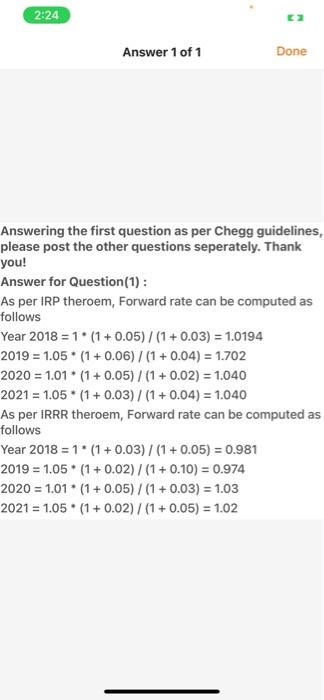
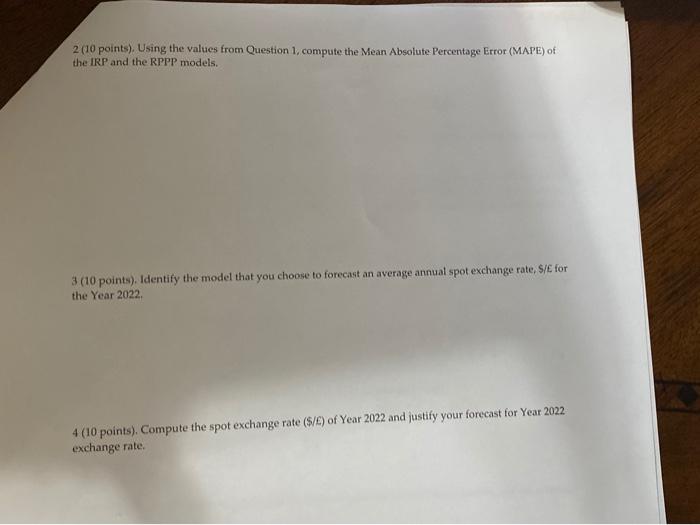
II. Year 2018 2019 Historical Inflation and Interest Data, the US and the UK Interest Rate Spot EXR US UK 5% 3% 1.0000 6% 4% 1.0500 5% 2% 1.1000 3% 4% 1.0500 Inflation Rate US UK 3% 5% 10% 5% 3% 2% 5% 2% 2020 2021 1 (10 points). Given the historical financial data in Table above, generate predicted spot exchange rates for Years 2019, 2020, and 2021 using the IRP and RPPP models. 2:24 Answer 1 of 1 Done Answering the first question as per Chegg guidelines, please post the other questions seperately. Thank you! Answer for Question (1): As per IRP theroem, Forward rate can be computed as follows Year 2018 = 1. (1 + 0.05)/(1+0.03) = 1.0194 2019 = 1.05 (1 + 0.06) / (1 + 0.04) = 1.702 2020 = 1.01 (1+0.05) / (1+0.02) = 1.040 2021 = 1.05 (1 + 0.03)/(1+0.04) = 1.040 As per IRRR theroem, Forward rate can be computed as follows Year 2018 = 1. (1 + 0.03)/(1+0.05) = 0.981 2019 = 1.05 (1 + 0.02)/(1+0.10) = 0.974 2020 = 1.01 * (1 + 0.05) / (1 + 0.03) = 1.03 2021 = 1.05. (1+0.02)/(1 + 0.05) = 1.02 2. (10 points). Using the values from Question 1, compute the Mean Absolute Percentage Error (MAPE) of the IRP and the RPPP models. 3 (10 points). Identify the model that you choose to forecast an average annual spot exchange rate, S/E for the Year 2022 4 (10 points). Compute the spot exchange rate (S/E) of Year 2022 and justify your forecast for Year 2022 exchange rate Step by Step Solution
There are 3 Steps involved in it
Step: 1

Get Instant Access to Expert-Tailored Solutions
See step-by-step solutions with expert insights and AI powered tools for academic success
Step: 2

Step: 3
Ace Your Homework with AI
Get the answers you need in no time with our AI-driven, step-by-step assistance
Get Started
Mastering Accounting Skills
Authors: Margaret Nicholson
3rd Edition
1403992703, 978-1403992703