Answered step by step
Verified Expert Solution
Question
1 Approved Answer
*(DO NOT COPY PASTE PREVIOUS ANSWERED QUESTIONS PLEASE, NEED NEW ANSWERS)* Depending on the given balance sheet for the three years period of 2021, 2020,
*(DO NOT COPY PASTE PREVIOUS ANSWERED QUESTIONS PLEASE, NEED NEW ANSWERS)*
Depending on the given balance sheet for the three years period of 2021, 2020, 2019 a company, Analyze its performance and changes during those three years including reasons (Common-Size Balance Sheet Analysis)
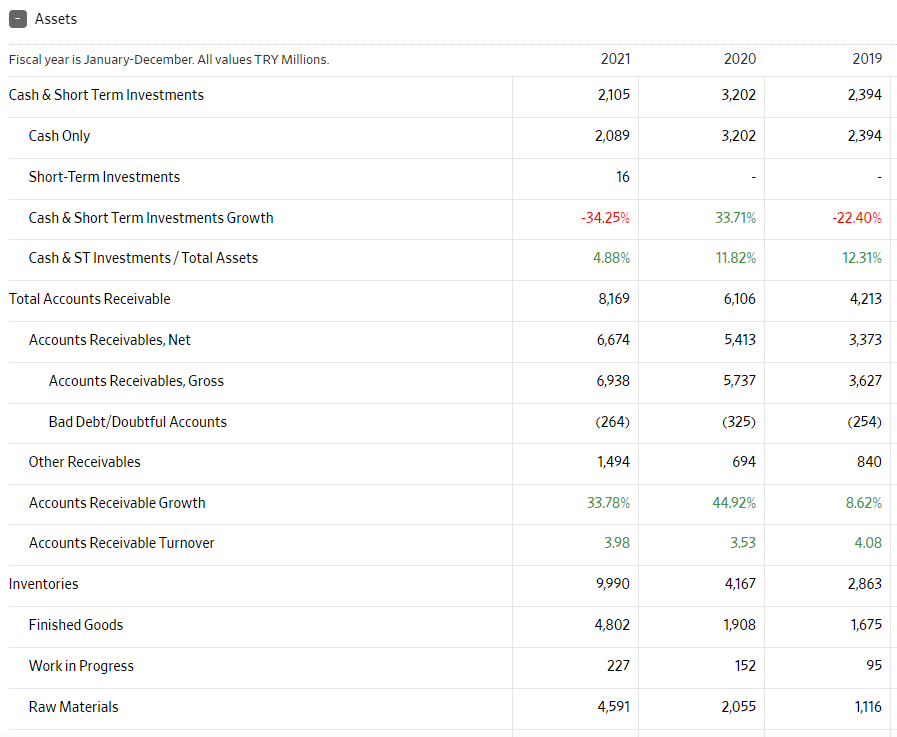
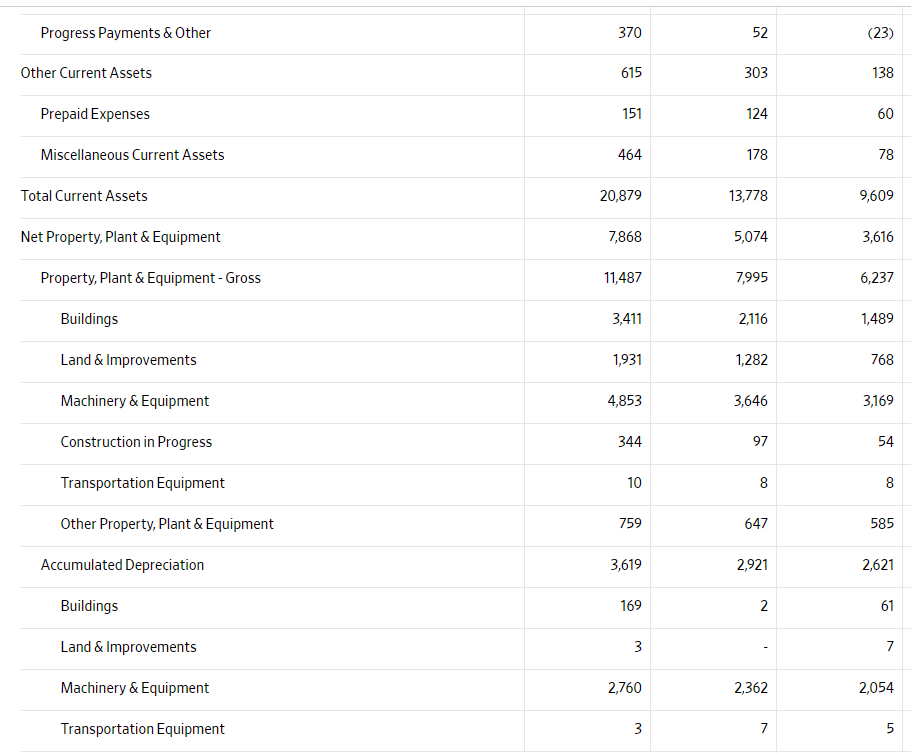
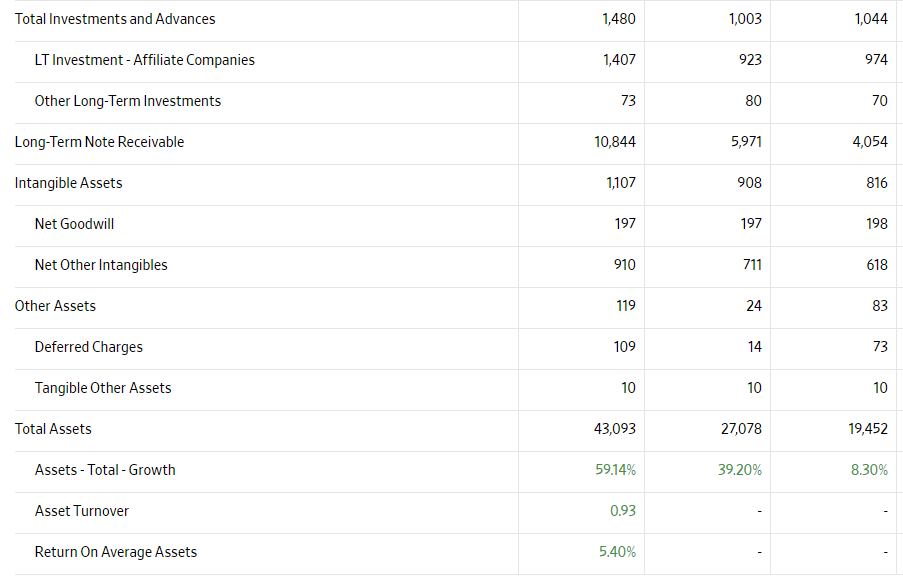
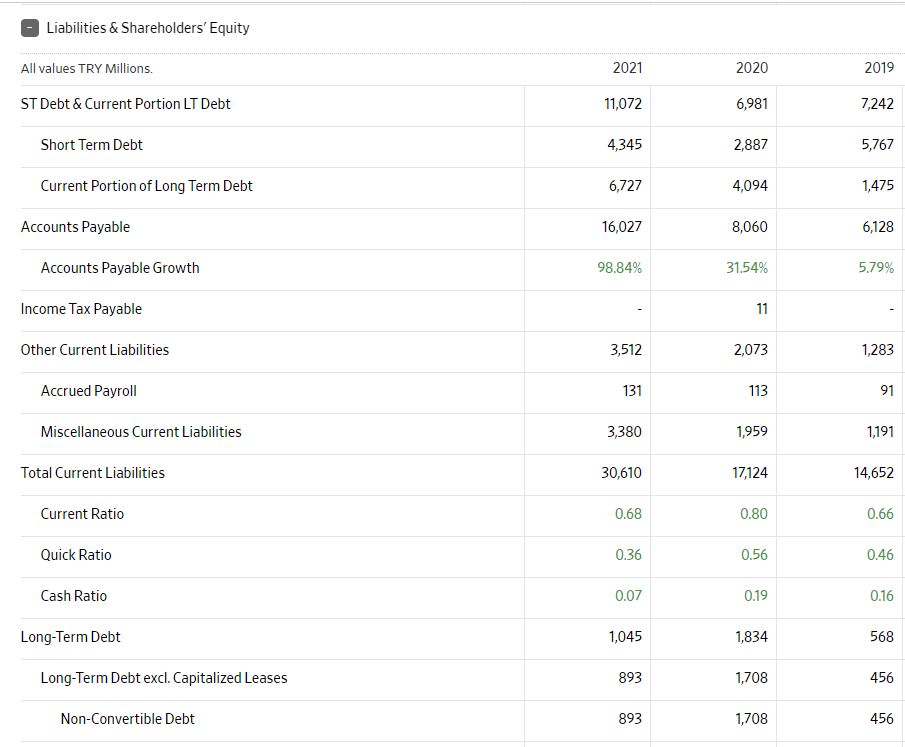
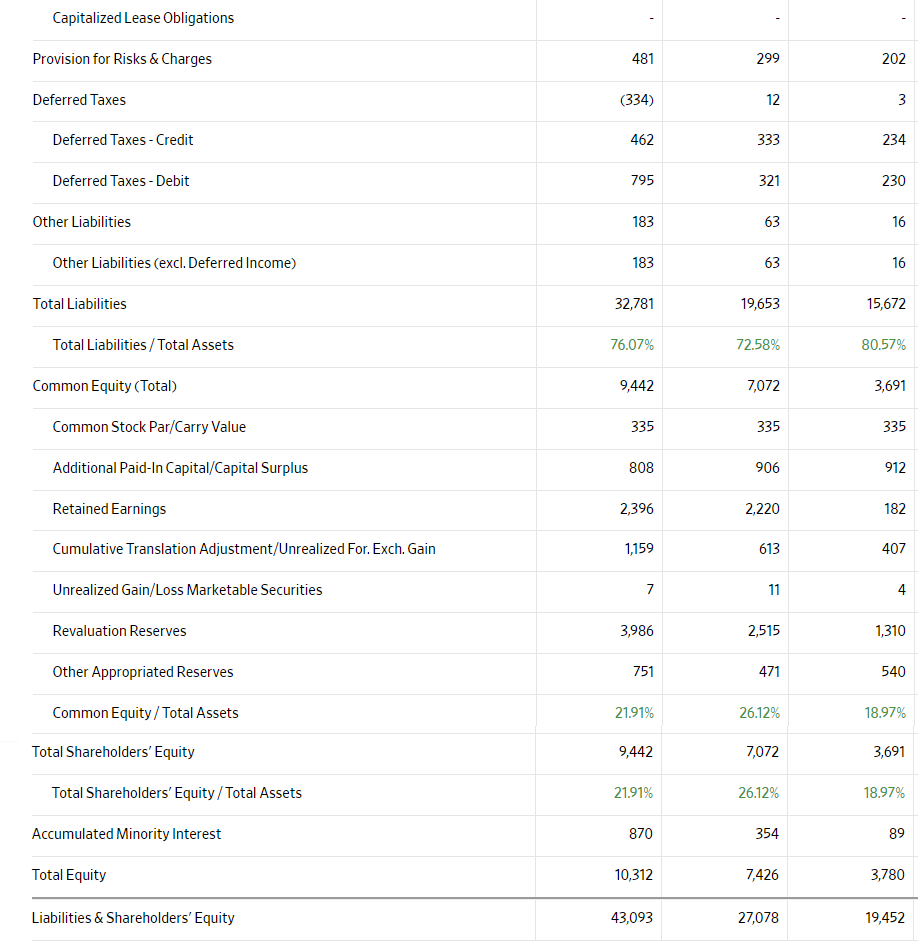
Assets Fiscal year is January-December. All values TRY Millions. Cash & Short Term Investments Cash Only Short-Term Investments Cash & Short Term Investments Growth Cash & ST Investments/Total Assets Total Accounts Receivable Accounts Receivables, Net Accounts Receivables, Gross Bad Debt/Doubtful Accounts Other Receivables Accounts Receivable Growth Accounts Receivable Turnover Finished Goods Work in Progress Raw Materials Inventories 2021 2,105 2,089 16 -34.25% 4.88% 8,169 6,674 6,938 (264) 1,494 33.78% 3.98 9,990 4,802 227 4,591 2020 3,202 3,202 33.71% 11.82% 6,106 5,413 5,737 (325) 694 44.92% 3.53 4,167 1,908 152 2,055 2019 2,394 2,394 -22.40% 12.31% 4,213 3,373 3,627 (254) 840 8.62% 4.08 2,863 1,675 95 1,116 Progress Payments & Other Other Current Assets Prepaid Expenses Miscellaneous Current Assets Total Current Assets Net Property, Plant & Equipment Property, Plant & Equipment - Gross Buildings Land & Improvements Machinery & Equipment Construction in Progress Transportation Equipment Other Property, Plant & Equipment Accumulated Depreciation Buildings Land & Improvements Machinery & Equipment Transportation Equipment 370 615 151 464 20,879 7,868 11,487 3,411 1,931 4,853 344 10 759 3,619 169 3 2,760 3 52 303 124 178 13,778 5,074 7,995 2,116 1,282 3,646 97 8 647 2,921 2 2,362 7 (23) 138 60 78 9,609 3,616 6,237 1,489 768 3,169 54 8 585 2,621 61 7 2,054 5 Total Investments and Advances LT Investment - Affiliate Companies Other Long-Term Investments Long-Term Note Receivable Intangible Assets Net Goodwill Net Other Intangibles Deferred Charges Tangible Other Assets Assets - Total - Growth Asset Turnover Return On Average Assets Other Assets Total Assets 1,480 1,407 73 10,844 1,107 197 910 119 109 10 43,093 59.14% 0.93 5.40% 1,003 923 80 5,971 908 197 711 24 14 10 27,078 39.20% 1,044 974 70 4,054 816 198 618 83 73 10 19,452 8.30% Liabilities & Shareholders' Equity All values TRY Millions. ST Debt & Current Portion LT Debt Short Term Debt Current Portion of Long Term Debt Accounts Payable Accounts Payable Growth Income Tax Payable Other Current Liabilities Accrued Payroll Miscellaneous Current Liabilities Total Current Liabilities Current Ratio Quick Ratio Cash Ratio Long-Term Debt Long-Term Debt excl. Capitalized Leases Non-Convertible Debt 2021 11,072 4,345 6,727 16,027 98.84% 3,512 131 3,380 30,610 0.68 0.36 0.07 1,045 893 893 2020 6,981 2,887 4,094 8,060 31.54% 11 2,073 113 1,959 17,124 0.80 0.56 0.19 1,834 1,708 1,708 2019 7,242 5,767 1,475 6,128 5.79% 1,283 91 1,191 14,652 0.66 0.46 0.16 568 456 456 Capitalized Lease Obligations Provision for Risks & Charges Deferred Taxes Deferred Taxes - Credit Deferred Taxes - Debit Other Liabilities Other Liabilities (excl. Deferred Income) Total Liabilities Total Liabilities/Total Assets Common Stock Par/Carry Value Additional Paid-In Capital/Capital Surplus Retained Earnings Cumulative Translation Adjustment/Unrealized For. Exch. Gain Unrealized Gain/Loss Marketable Securities Revaluation Reserves Other Appropriated Reserves Common Equity/Total Assets Total Shareholders' Equity Total Shareholders' Equity/Total Assets Accumulated Minority Interest Total Equity Liabilities & Shareholders' Equity Common Equity (Total) 481 (334) 462 795 183 183 32,781 76.07% 9,442 335 808 2,396 1,159 7 3,986 751 21.91% 9,442 21.91% 870 10,312 43,093 299 12 333 321 63 63 19,653 72.58% 7,072 335 906 2,220 613 11 2,515 471 26.12% 7,072 26.12% 354 7,426 27,078 202 3 234 230 16 16 15,672 80.57% 3,691 335 912 182 407 4 1,310 540 18.97% 3,691 18.97% 89 3,780 19,452 Assets Fiscal year is January-December. All values TRY Millions. Cash & Short Term Investments Cash Only Short-Term Investments Cash & Short Term Investments Growth Cash & ST Investments/Total Assets Total Accounts Receivable Accounts Receivables, Net Accounts Receivables, Gross Bad Debt/Doubtful Accounts Other Receivables Accounts Receivable Growth Accounts Receivable Turnover Finished Goods Work in Progress Raw Materials Inventories 2021 2,105 2,089 16 -34.25% 4.88% 8,169 6,674 6,938 (264) 1,494 33.78% 3.98 9,990 4,802 227 4,591 2020 3,202 3,202 33.71% 11.82% 6,106 5,413 5,737 (325) 694 44.92% 3.53 4,167 1,908 152 2,055 2019 2,394 2,394 -22.40% 12.31% 4,213 3,373 3,627 (254) 840 8.62% 4.08 2,863 1,675 95 1,116 Progress Payments & Other Other Current Assets Prepaid Expenses Miscellaneous Current Assets Total Current Assets Net Property, Plant & Equipment Property, Plant & Equipment - Gross Buildings Land & Improvements Machinery & Equipment Construction in Progress Transportation Equipment Other Property, Plant & Equipment Accumulated Depreciation Buildings Land & Improvements Machinery & Equipment Transportation Equipment 370 615 151 464 20,879 7,868 11,487 3,411 1,931 4,853 344 10 759 3,619 169 3 2,760 3 52 303 124 178 13,778 5,074 7,995 2,116 1,282 3,646 97 8 647 2,921 2 2,362 7 (23) 138 60 78 9,609 3,616 6,237 1,489 768 3,169 54 8 585 2,621 61 7 2,054 5 Total Investments and Advances LT Investment - Affiliate Companies Other Long-Term Investments Long-Term Note Receivable Intangible Assets Net Goodwill Net Other Intangibles Deferred Charges Tangible Other Assets Assets - Total - Growth Asset Turnover Return On Average Assets Other Assets Total Assets 1,480 1,407 73 10,844 1,107 197 910 119 109 10 43,093 59.14% 0.93 5.40% 1,003 923 80 5,971 908 197 711 24 14 10 27,078 39.20% 1,044 974 70 4,054 816 198 618 83 73 10 19,452 8.30% Liabilities & Shareholders' Equity All values TRY Millions. ST Debt & Current Portion LT Debt Short Term Debt Current Portion of Long Term Debt Accounts Payable Accounts Payable Growth Income Tax Payable Other Current Liabilities Accrued Payroll Miscellaneous Current Liabilities Total Current Liabilities Current Ratio Quick Ratio Cash Ratio Long-Term Debt Long-Term Debt excl. Capitalized Leases Non-Convertible Debt 2021 11,072 4,345 6,727 16,027 98.84% 3,512 131 3,380 30,610 0.68 0.36 0.07 1,045 893 893 2020 6,981 2,887 4,094 8,060 31.54% 11 2,073 113 1,959 17,124 0.80 0.56 0.19 1,834 1,708 1,708 2019 7,242 5,767 1,475 6,128 5.79% 1,283 91 1,191 14,652 0.66 0.46 0.16 568 456 456 Capitalized Lease Obligations Provision for Risks & Charges Deferred Taxes Deferred Taxes - Credit Deferred Taxes - Debit Other Liabilities Other Liabilities (excl. Deferred Income) Total Liabilities Total Liabilities/Total Assets Common Stock Par/Carry Value Additional Paid-In Capital/Capital Surplus Retained Earnings Cumulative Translation Adjustment/Unrealized For. Exch. Gain Unrealized Gain/Loss Marketable Securities Revaluation Reserves Other Appropriated Reserves Common Equity/Total Assets Total Shareholders' Equity Total Shareholders' Equity/Total Assets Accumulated Minority Interest Total Equity Liabilities & Shareholders' Equity Common Equity (Total) 481 (334) 462 795 183 183 32,781 76.07% 9,442 335 808 2,396 1,159 7 3,986 751 21.91% 9,442 21.91% 870 10,312 43,093 299 12 333 321 63 63 19,653 72.58% 7,072 335 906 2,220 613 11 2,515 471 26.12% 7,072 26.12% 354 7,426 27,078 202 3 234 230 16 16 15,672 80.57% 3,691 335 912 182 407 4 1,310 540 18.97% 3,691 18.97% 89 3,780 19,452
Step by Step Solution
There are 3 Steps involved in it
Step: 1

Get Instant Access to Expert-Tailored Solutions
See step-by-step solutions with expert insights and AI powered tools for academic success
Step: 2

Step: 3

Ace Your Homework with AI
Get the answers you need in no time with our AI-driven, step-by-step assistance
Get Started


