Answered step by step
Verified Expert Solution
Link Copied!

Question

1 Approved Answer

do not understand question 4. Open the attached Excel file and copy the data into Minitab. The Freshman BMI Data includes the BMI levels of

do not understand question
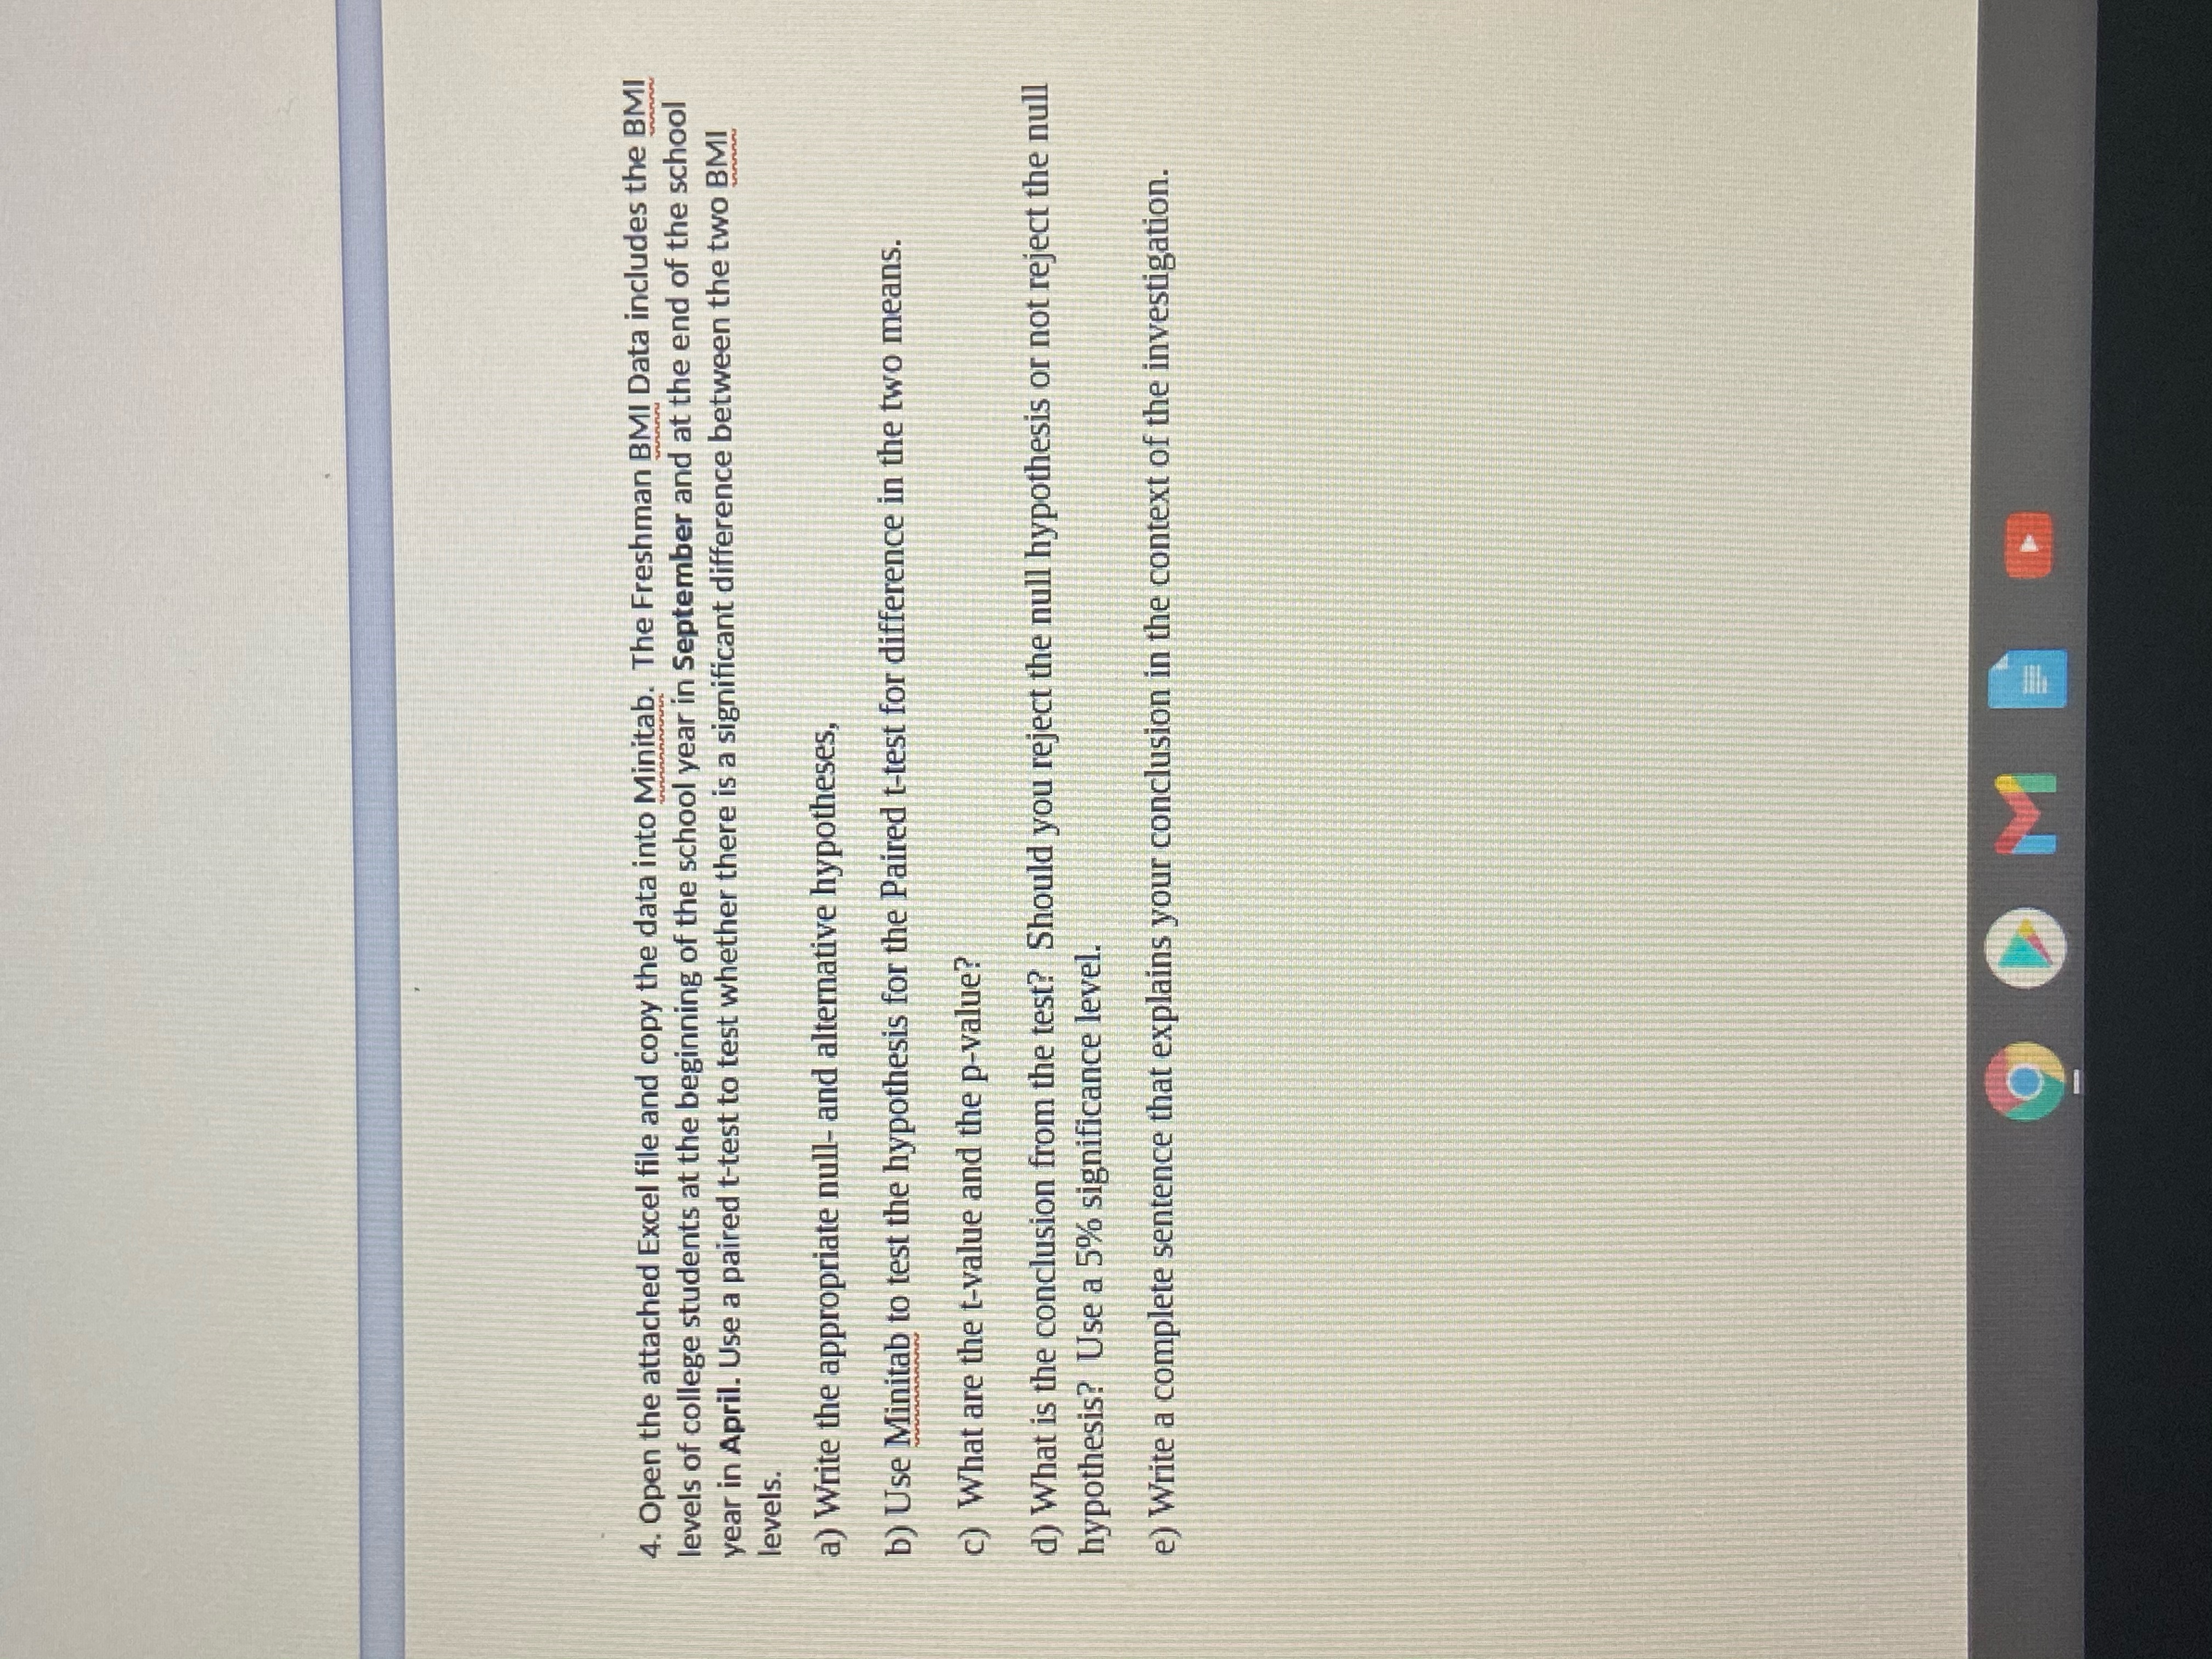
image text in transcribed
4. Open the attached Excel file and copy the data into Minitab. The Freshman BMI Data includes the BMI levels of college students at the beginning of the school year in September and at the end of the school year in April. Use a paired t-test to test whether there is a significant difference between the two BMI levels. a) Write the appropriate null- and alternative hypotheses, b) Use Minitab to test the hypothesis for the Paired t-test for difference in the two means. c) What are the t-value and the p-value? d) What is the conclusion from the test? Should you reject the null hypothesis or not reject the null hypothesis? Use a 5% significance level. e) Write a complete sentence that explains your conclusion in the context of the investigation

Step by Step Solution

There are 3 Steps involved in it

Step: 1

blur-text-image

Get Instant Access to Expert-Tailored Solutions

See step-by-step solutions with expert insights and AI powered tools for academic success

Step: 2

blur-text-image_2

Step: 3

blur-text-image_3

Ace Your Homework with AI

Get the answers you need in no time with our AI-driven, step-by-step assistance

Get Started

Recommended Textbook for

Essential University Physics

Authors: Richard Wolfson

2nd Edition

0321706692, 978-0321706690

More Books

Students also viewed these Mathematics questions