Answered step by step
Verified Expert Solution
Link Copied!

Question

1 Approved Answer

Do not use excel for calculations. Use formulas and show your work for the mean return and the standard deviation. Select two stocks. Find the
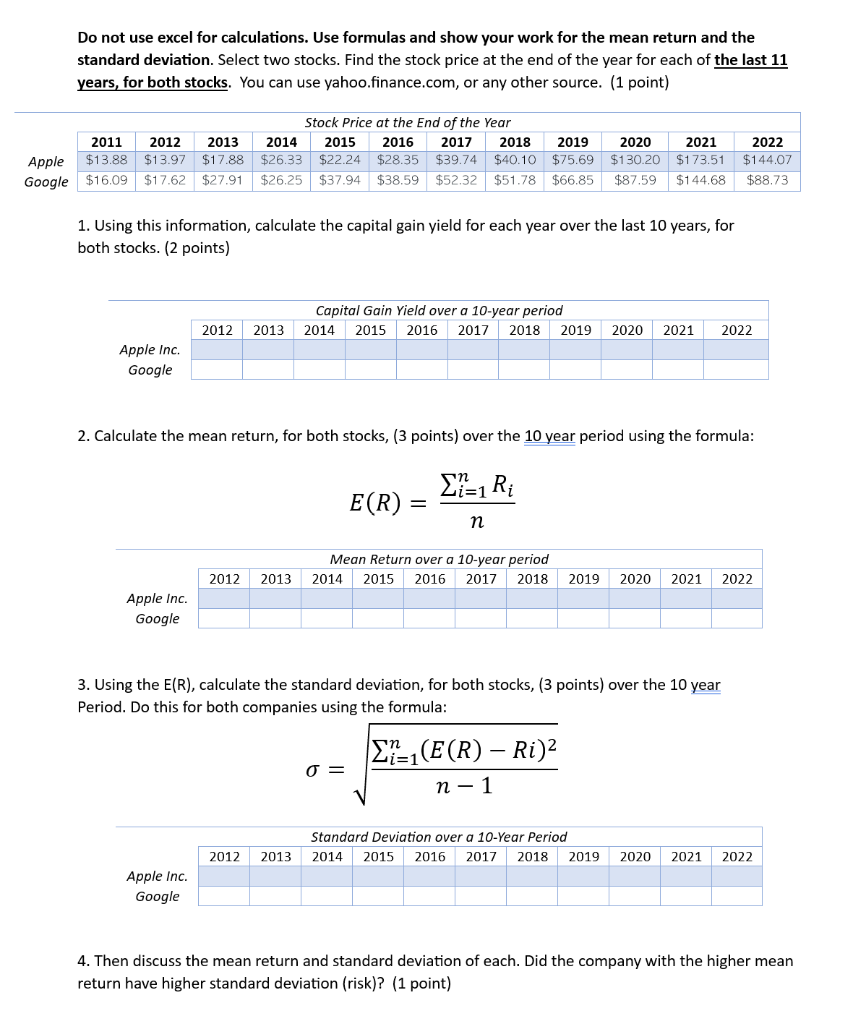
image text in transcribed

Do not use excel for calculations. Use formulas and show your work for the mean return and the standard deviation. Select two stocks. Find the stock price at the end of the year for each of the last 11 years, for both stocks. You can use yahoo.finance.com, or any other source. (1 point) 1. Using this information, calculate the capital gain yield for each year over the last 10 years, for both stocks. ( 2 points) Apple Gooc 2. Calculate the mean return, for both stocks, ( 3 points) over the 10 year period using the formula: E(R)=ni=1nRi Apple in Google 3. Using the E(R), calculate the standard deviation, for both stocks, (3 points) over the 10 year Period. Do this for both companies using the formula: =n1i=1n(E(R)Ri)2 Standard Deviation nuer a 10-Year Perind Apple It Googl 4. Then discuss the mean return and standard deviation of each. Did the company with the higher mean return have higher standard deviation (risk)? (1 point)

Step by Step Solution

There are 3 Steps involved in it

Step: 1

blur-text-image

Get Instant Access to Expert-Tailored Solutions

See step-by-step solutions with expert insights and AI powered tools for academic success

Step: 2

blur-text-image_2

Step: 3

blur-text-image_3

Ace Your Homework with AI

Get the answers you need in no time with our AI-driven, step-by-step assistance

Get Started

Recommended Textbook for

Principles Of Managerial Finance

Authors: Lawrence J. Gitman, Chad J. Zutter

13th Edition

9780132738729, 136119468, 132738724, 978-0136119463

More Books

Students also viewed these Finance questions

Question

What are the major methods of informing?

Answered: 1 week ago

Question

What is Working Capital ? Explain its types.

Answered: 1 week ago