Answered step by step
Verified Expert Solution
Question
1 Approved Answer
DO NOT WRITE ANSWERS !! PLEASE TYPE ANSWERS SO THEY CAN LOOK SIMILAR TO THIS : AGAIN PLEASE TYPE ANSWERS SO THEY CAN LOOK SIMILAR
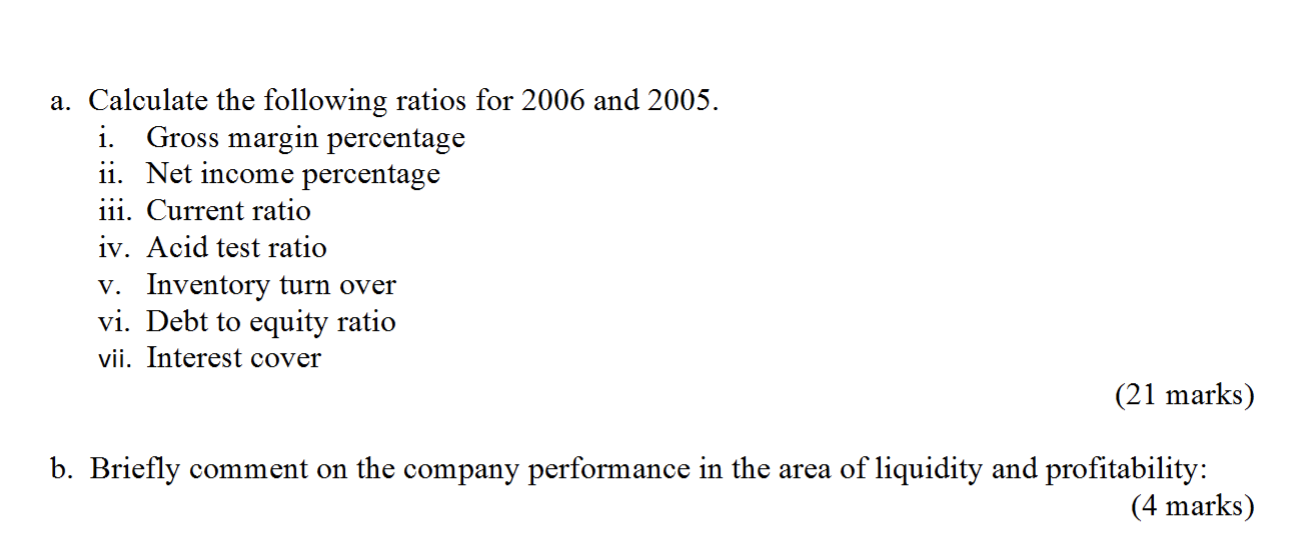
DO NOT WRITE ANSWERS !! PLEASE TYPE ANSWERS SO THEY CAN LOOK SIMILAR TO THIS :
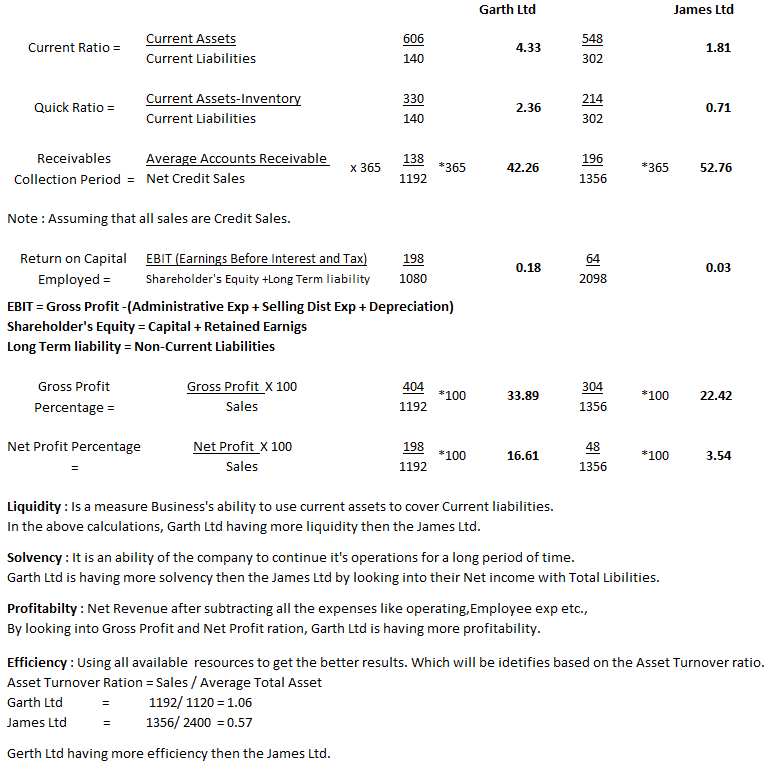
AGAIN PLEASE TYPE ANSWERS SO THEY CAN LOOK SIMILAR TO THE ABOVE PHOTO !!
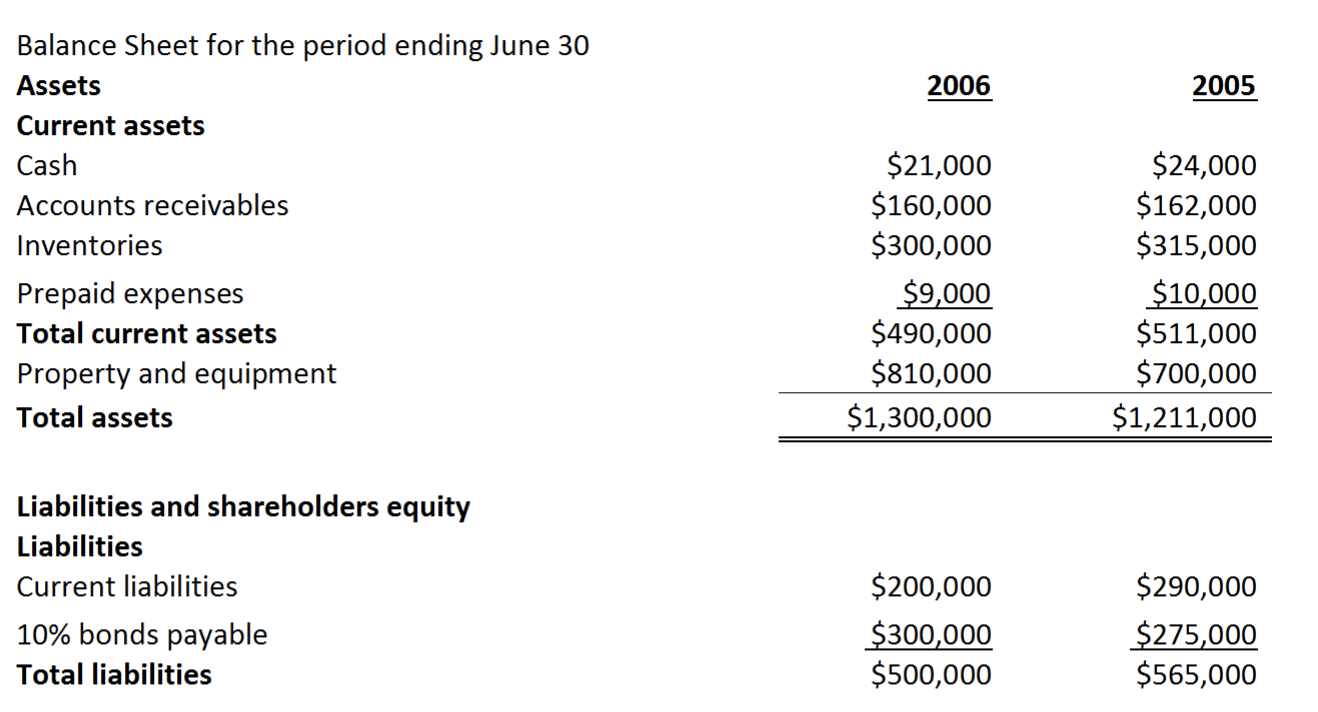
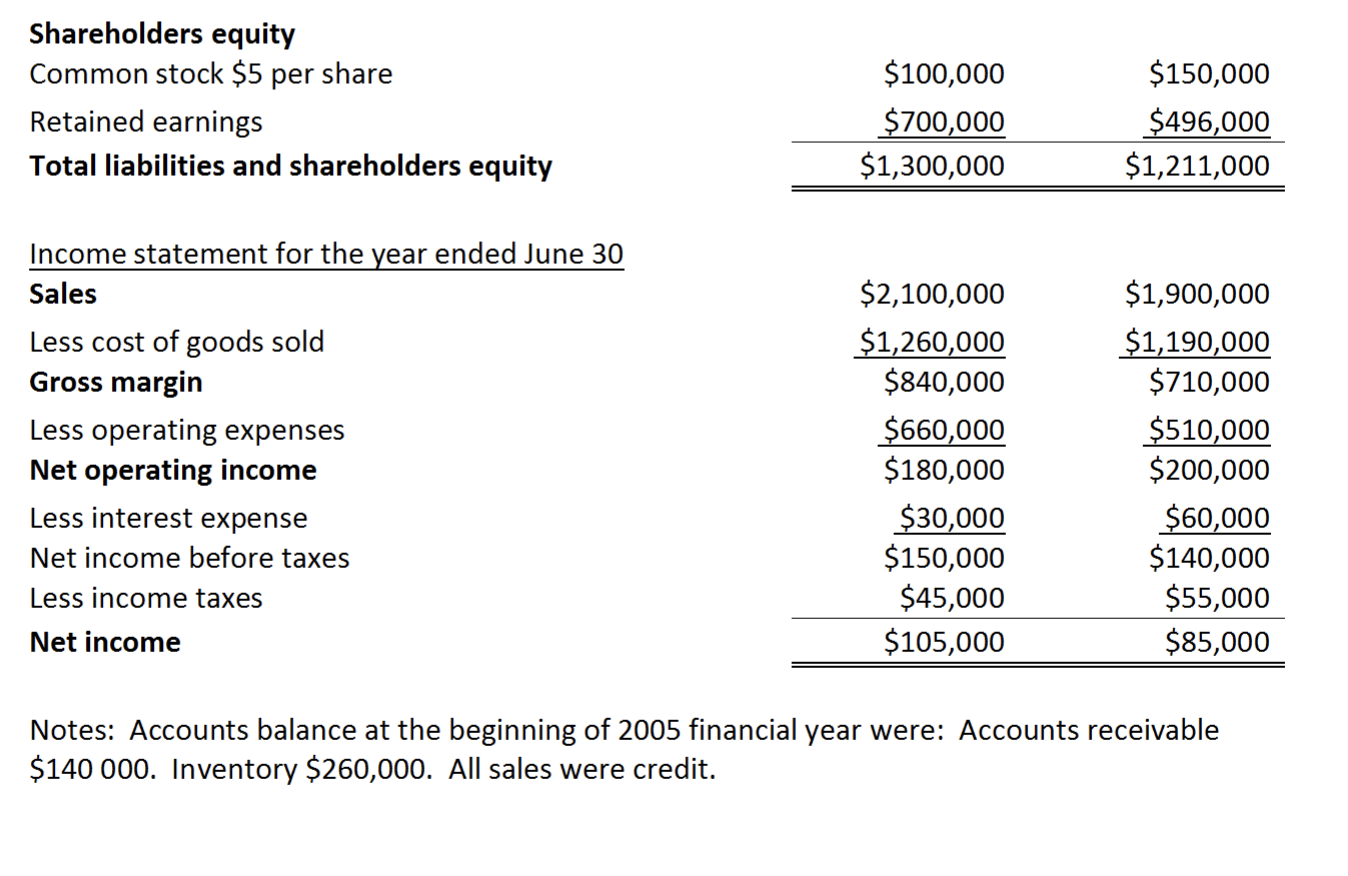
Balance Sheet for the period ending June 30 Assets 2006 2005 Current assets $21,000 $160,000 $300,000 $24,000 $162,000 $315,000 Cash Accounts receivables Inventories $9,000 $490,000 $810,000 $10,000 $511,000 Prepaid expenses Total current assets $700,000 $1,211,000 Property and equipment $1,300,000 Total assets Liabilities and shareholders equity Liabilities $200,000 $290,000 Current liabilities $300,000 $500,000 10% bonds payable $275,000 $565,000 Total liabilities Shareholders equity Common stock $5 per share $100,000 $150,000 Retained earnings $700,000 $1,300,000 $496,000 $1,211,000 Total liabilities and shareholders equity Income statement for the year ended June 30 $2,100,000 $1,900,000 Sales $1,260,000 $840,000 $1,190,000 $710,000 Less cost of goods sold Gross margin $660,000 $180,000 Less operating expenses $510,000 $200,000 Net operating income Less interest expense $30,000 $150,000 $45,000 $60,000 $140,000 $55,000 Net income before taxes Less income taxes $105,000 $85,000 Net income Notes: Accounts balance at the beginning of 2005 financial year were: Accounts receivable $140 000. Inventory $260,000. All sales were credit. Garth Ltd James Ltd Current Assets 606 548 Current Ratio 1.81 4.33 Current Liabilities 140 302 Current Assets-Inventory 330 214 Quick Ratio 2.36 0.71 Current Liabilities 140 302 Average Accounts Receivable Receivables 138 196 #365 365 *365 42.26 52.76 Collection Period Net Credit Sales 1192 1356 Note Assuming that all sales are Credit Sales EBIT (Earnings Before Interest and Tax) Shareholder's Equity +Long Term liability EBIT Gross Profit-(Administrative Exp + Selling Dist Exp + Depreciation) Return on Capital 198 64 0.03 0.18 1080 Employed = 2098 Shareholder's Equity Capital Retained Earnigs Long Term liability Non-Current Liabilities Gross Profit Gross Profit X 100 404 304 100 100 33.89 22.42 Sales 1192 1356 Percentage = Net Profit Percentage Net Profit X 100 198 48 100 100 16.61 3.54 Sales 1192 1356 Liquidity Is a measure Business's ability to use current assets to cover Current liabilities. In the above calculations, Garth Ltd having more liquidity then the James Ltd. Solvency: It is an ability of the company to continue it's operations for a long period of time. Garth Ltd is having more solvency then the James Ltd by looking into their Net income with Total Libilities. Profitabilty: Net Revenue after subtracting all the expenses like operating,Employee exp etc. By looking into Gross Profit and Net Profit ration, Garth Ltd is having more profitability. Efficiency: Using all available resources to get the better results. Which will be idetifies based on the Asset Turnover ratio Asset Turnover Ration Sales/ Average Total Asset 1192/1120 1.06 Garth Ltd 1356/ 2400 0.57 James Ltd Gerth Ltd having more efficiency then the James LtdStep by Step Solution
There are 3 Steps involved in it
Step: 1

Get Instant Access to Expert-Tailored Solutions
See step-by-step solutions with expert insights and AI powered tools for academic success
Step: 2

Step: 3

Ace Your Homework with AI
Get the answers you need in no time with our AI-driven, step-by-step assistance
Get Started


