Do states with higher percentages of immigration population have a higher crime rate? Name: MA135 Statistical Applications Final Project Part 1 Part 1: Developing a
Do states with higher percentages of immigration population have a higher crime rate?
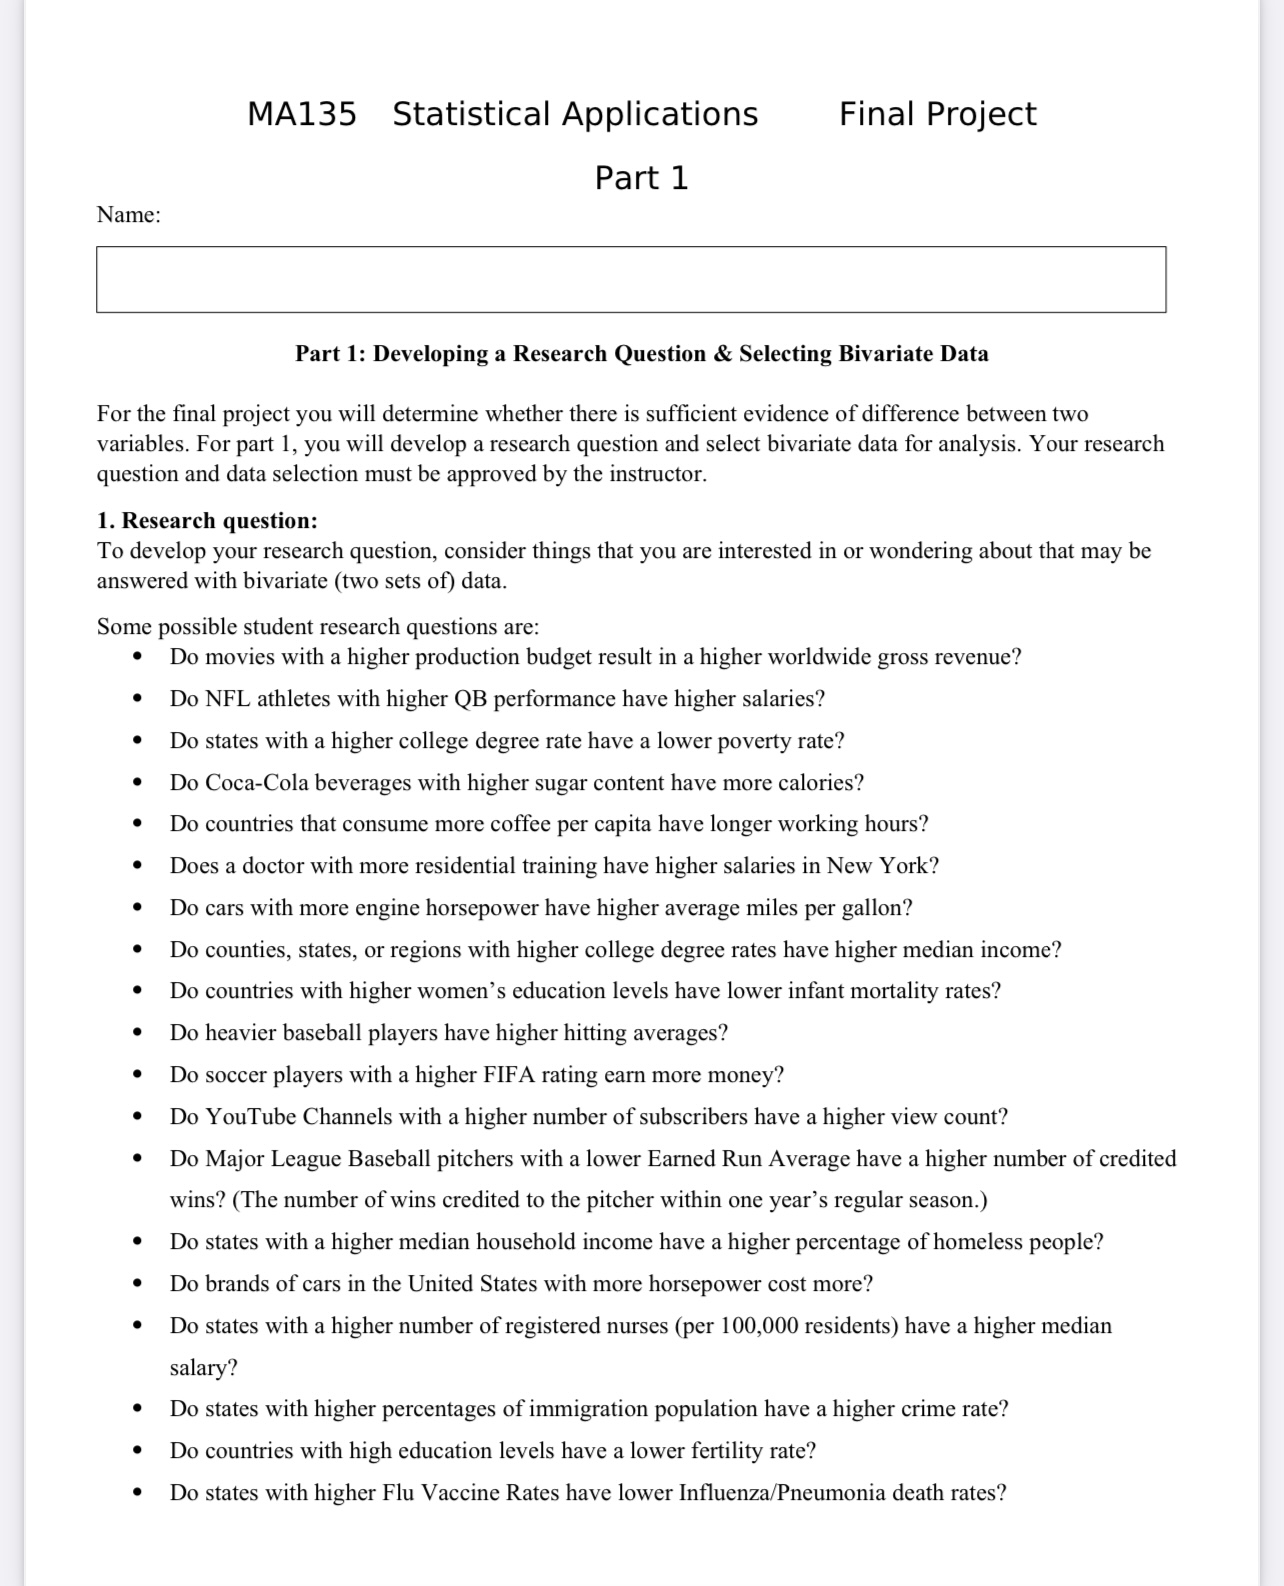
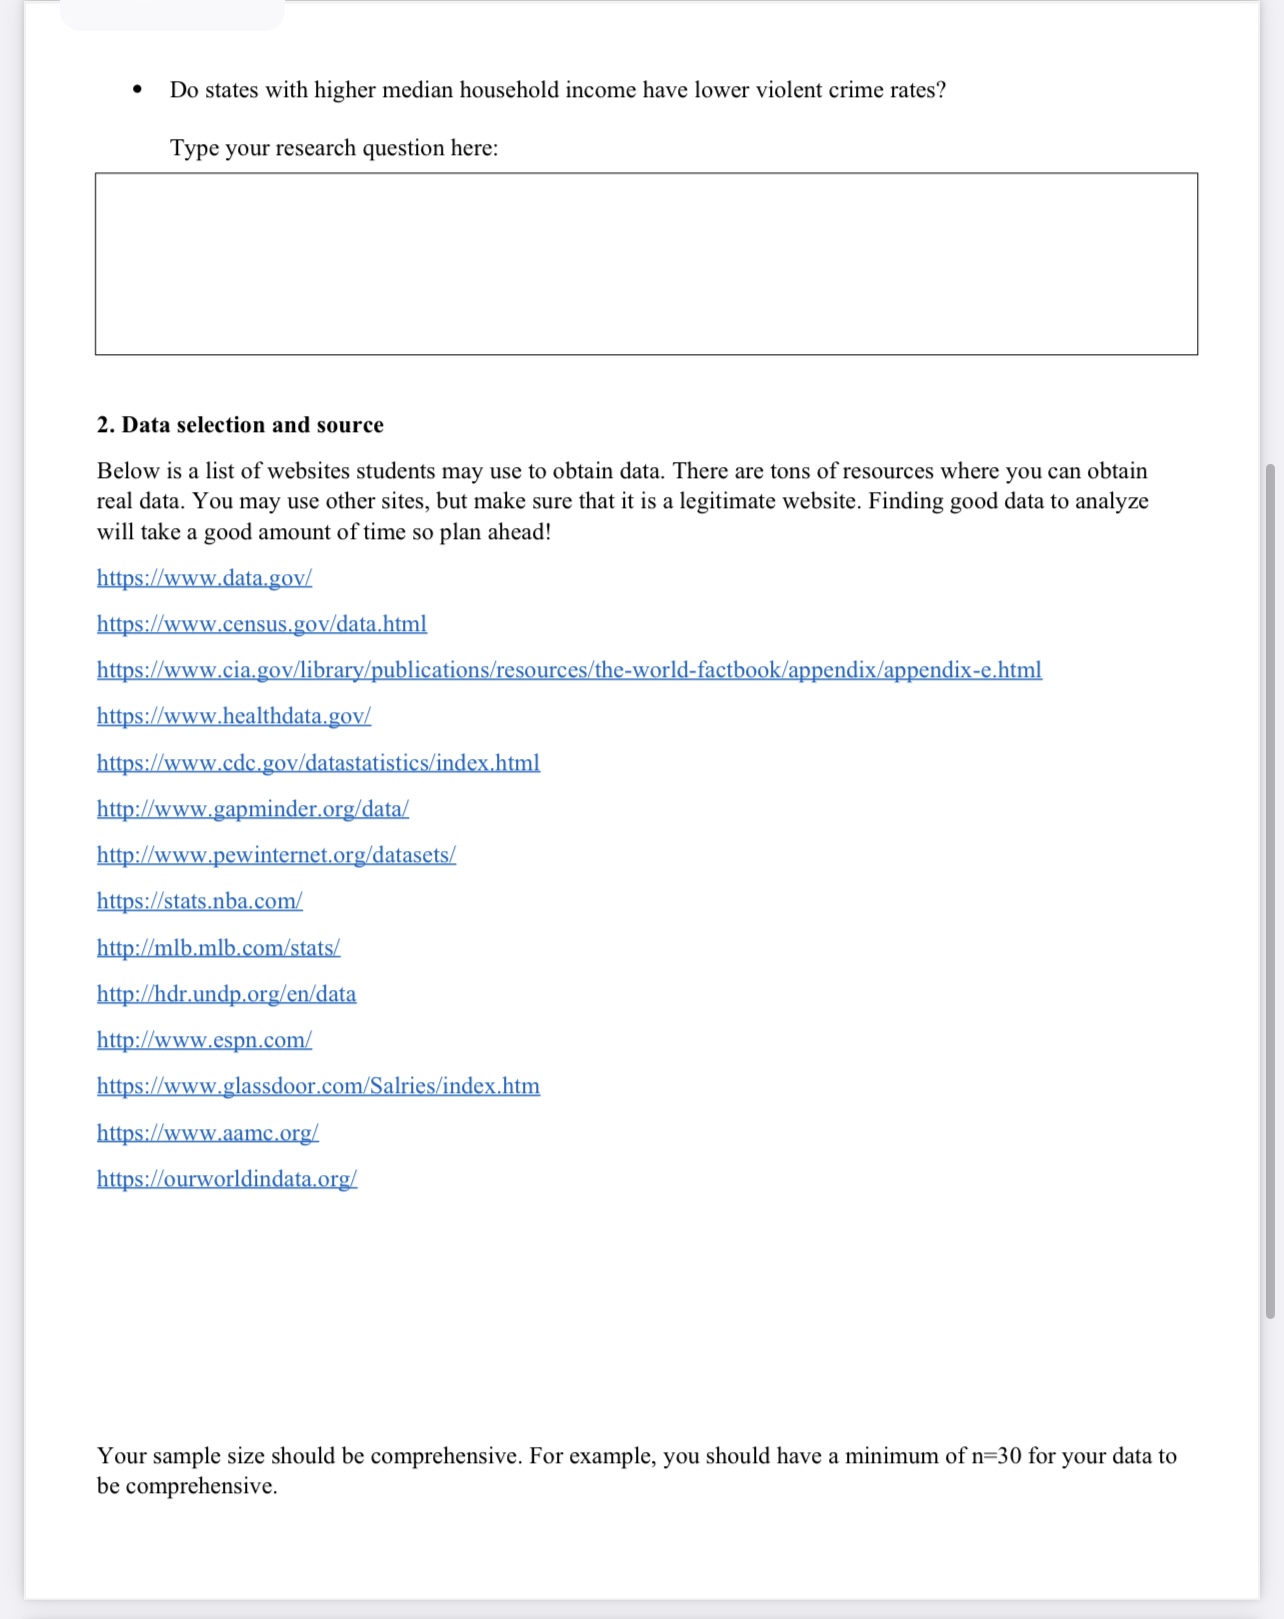
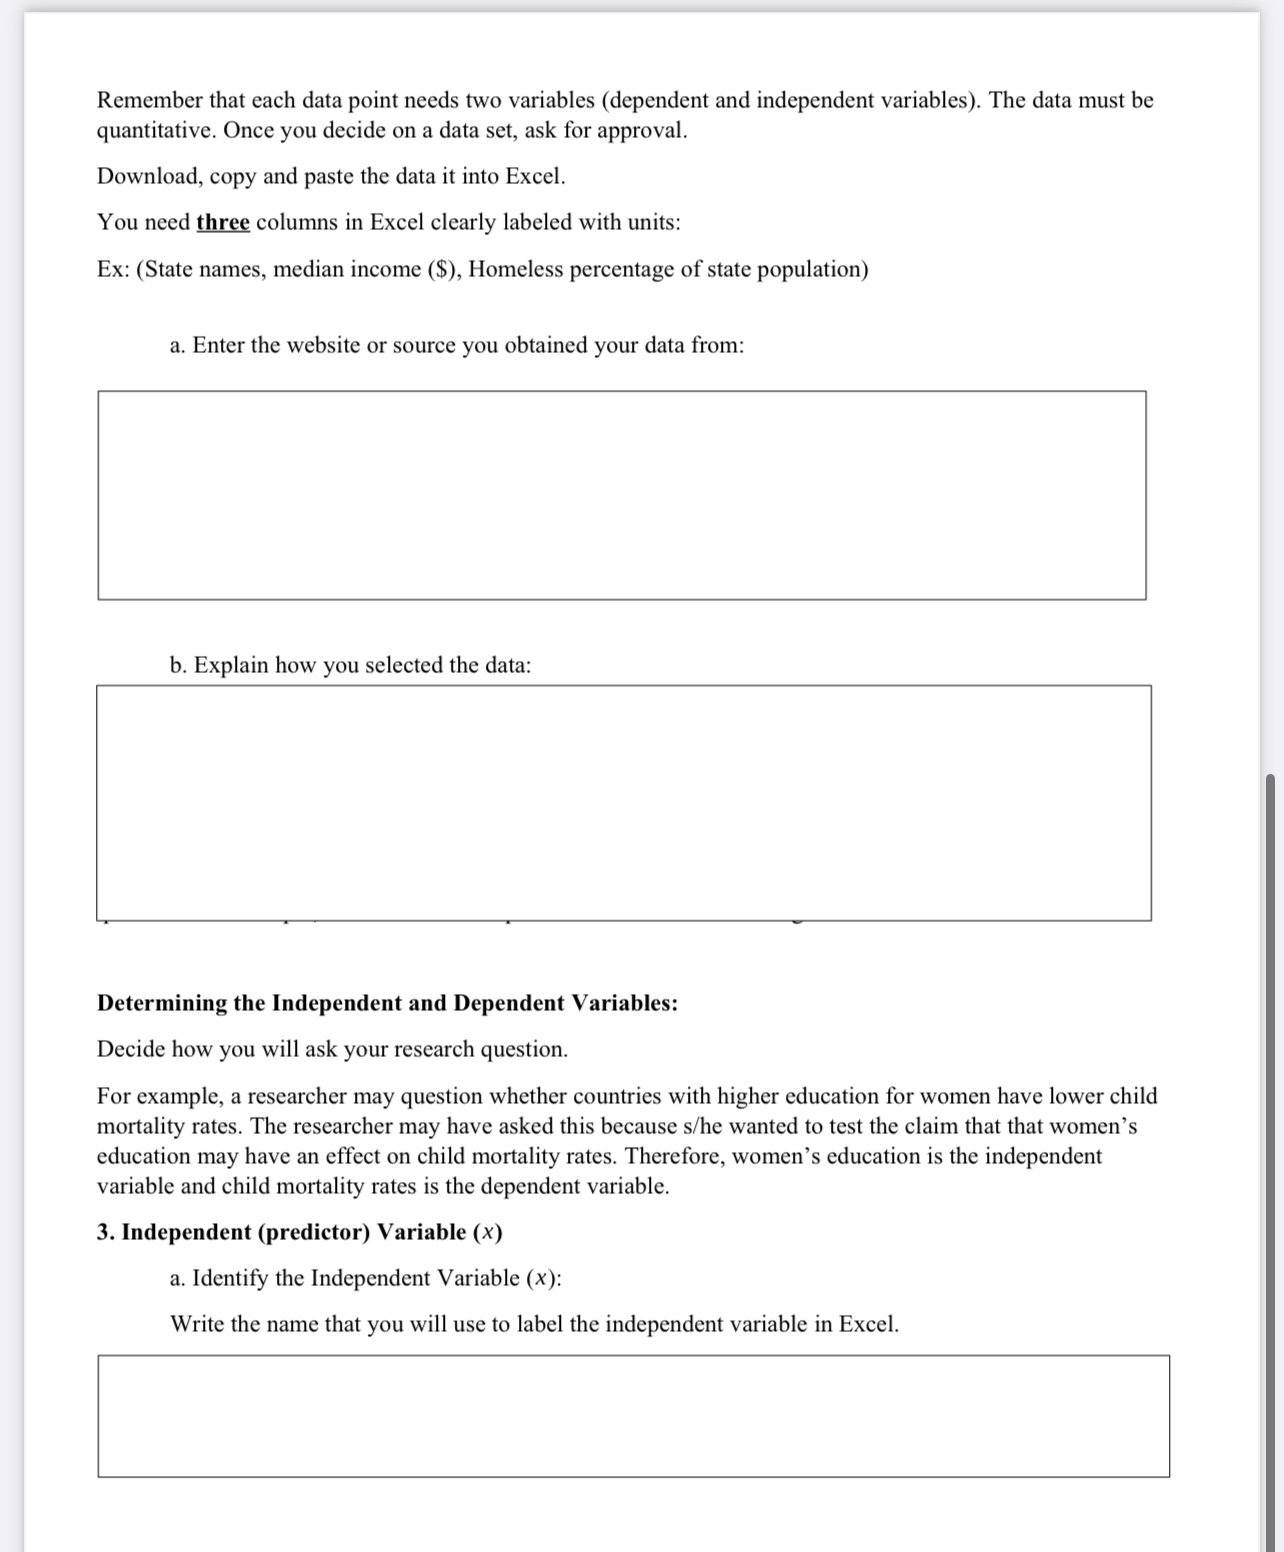
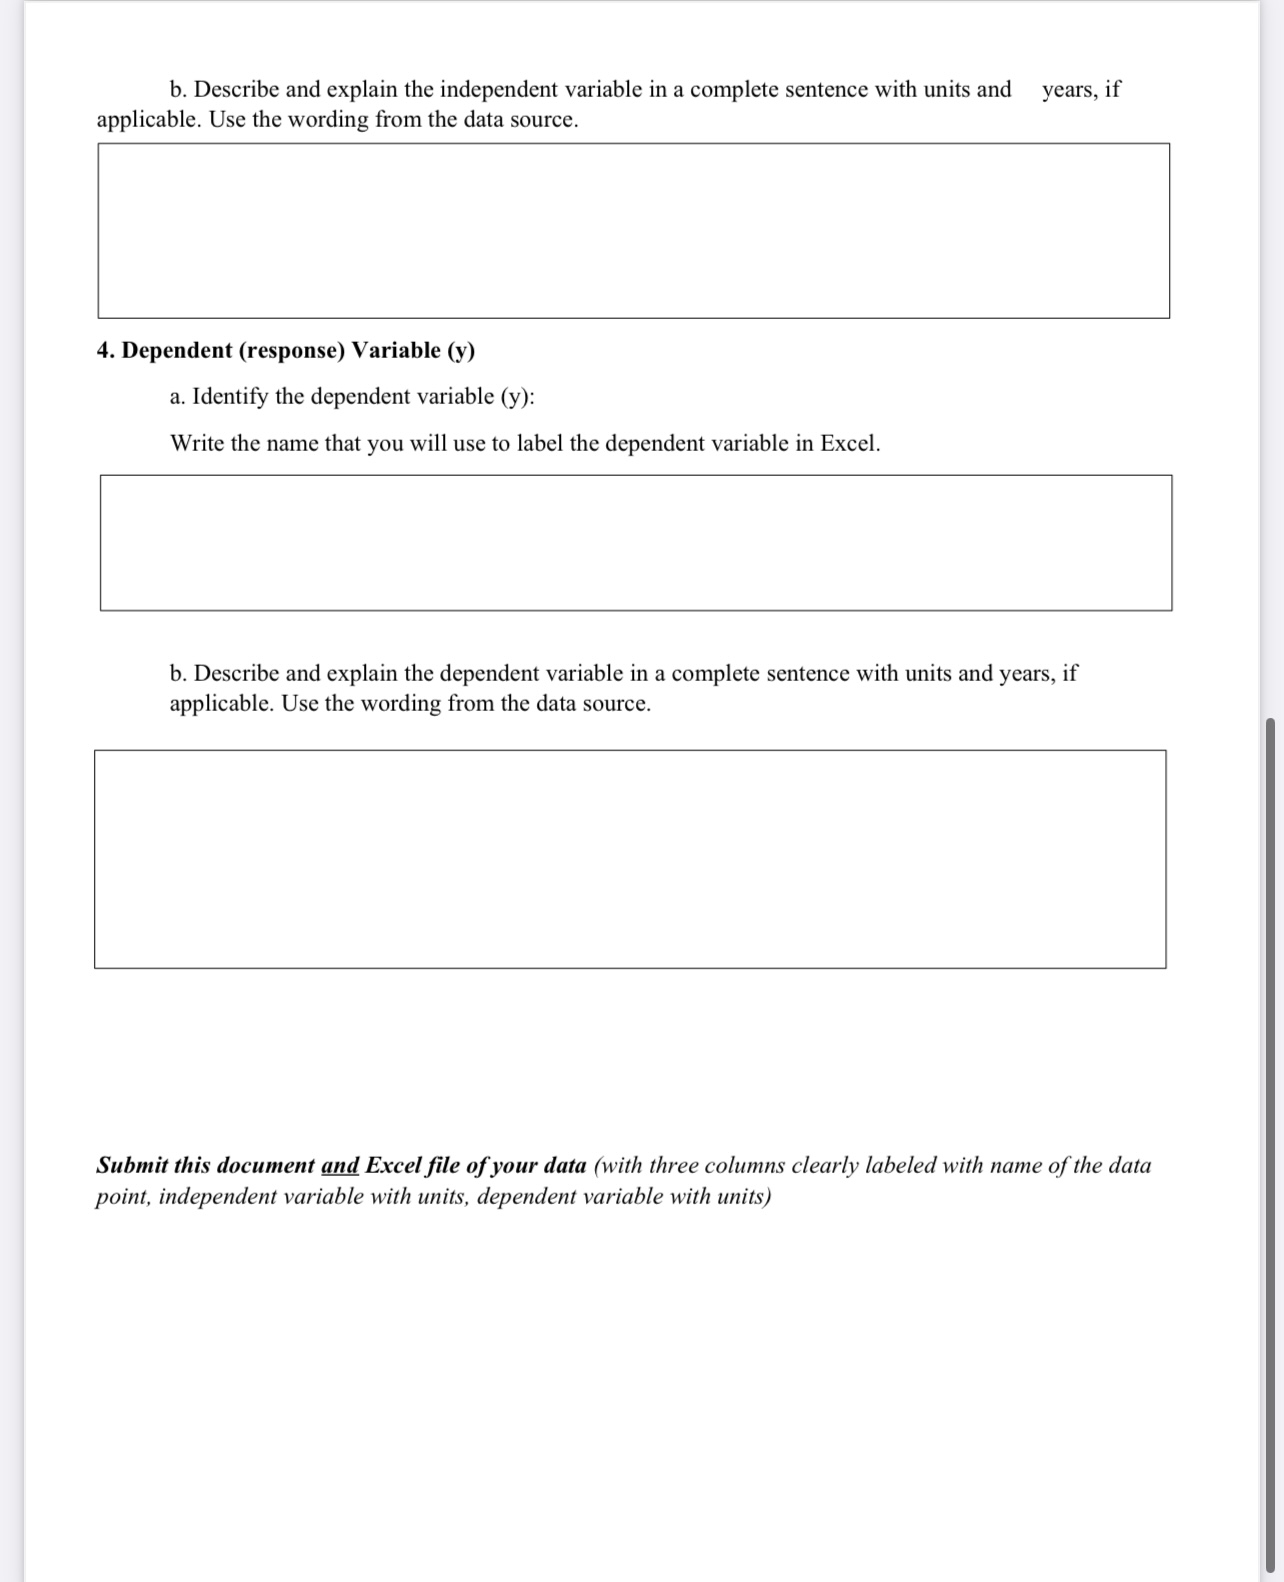
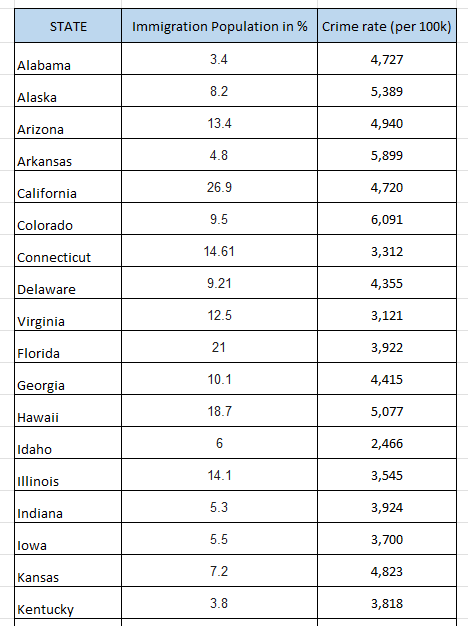
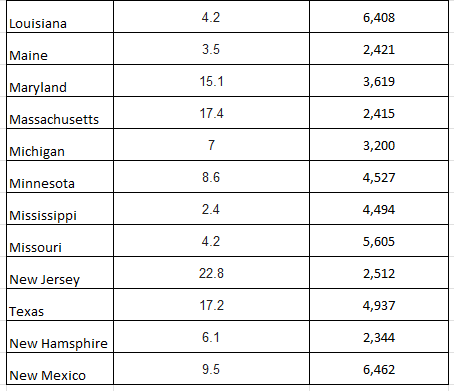
Name: MA135 Statistical Applications Final Project Part 1 Part 1: Developing a Research Question & Selecting Bivariate Data For the final project you will determine whether there is sufficient evidence of difference between two variables. For part 1, you will develop a research question and select bivariate data for analysis. Your research question and data selection must be approved by the instructor. 1. Research question: To develop your research question, consider things that you are interested in or wondering about that may be answered with bivariate (two sets of) data. Some possible student research questions are: Do movies with a higher production budget result in a higher worldwide gross revenue? Do NFL athletes with higher QB performance have higher salaries? Do states with a higher college degree rate have a lower poverty rate? Do Coca-Cola beverages with higher sugar content have more calories? Do countries that consume more coffee per capita have longer working hours? Does a doctor with more residential training have higher salaries in New York? Do cars with more engine horsepower have higher average miles per gallon? Do counties, states, or regions with higher college degree rates have higher median income? Do countries with higher women's education levels have lower infant mortality rates? Do heavier baseball players have higher hitting averages? Do soccer players with a higher FIFA rating earn more money? Do YouTube Channels with a higher number of subscribers have a higher view count? Do Major League Baseball pitchers with a lower Earned Run Average have a higher number of credited wins? (The number of wins credited to the pitcher within one year's regular season.) Do states with a higher median household income have a higher percentage of homeless people? Do brands of cars in the United States with more horsepower cost more? Do states with a higher number of registered nurses (per 100,000 residents) have a higher median salary? Do states with higher percentages of immigration population have a higher crime rate? Do countries with high education levels have a lower fertility rate? Do states with higher Flu Vaccine Rates have lower Influenza/Pneumonia death rates? . Do states with higher median household income have lower violent crime rates? Type your research question here: 2. Data selection and source Below is a list of websites students may use to obtain data. There are tons of resources where you can obtain real data. You may use other sites, but make sure that it is a legitimate website. Finding good data to analyze will take a good amount of time so plan ahead! https:/www.data.gov/ https:/www.census.gov/data.html https:/www.cia.gov/library/publications/resources/the-world-factbook/appendix/appendix-e.html https:/www.healthdata.gov/ https://www.cdc.gov/datastatistics/index.html http:/www.gapminder.org/data/ http://www.pewinternet.org/datasets/ https:/stats.nba.com/ http://mlb.mlb.com/stats/ http://hdr.undp.org/en/data http:/www.espn.com/ https:/www.glassdoor.com/Salries/index.htm https:/www.aamc.org/ https://ourworldindata.org/ Your sample size should be comprehensive. For example, you should have a minimum of n=30 for your data to be comprehensive.Remember that each data point needs two variables (dependent and independent variables). The data must be quantitative. Once you decide on a data set, ask for approval. Download, copy and paste the data it into Excel. You need three columns in Excel clearly labeled with units: Ex: (State names, median income ($), Homeless percentage of state population) a. Enter the website or source you obtained your data from: b. Explain how you selected the data: Determining the Independent and Dependent Variables: Decide how you will ask your research question. For example, a researcher may question whether countries with higher education for women have lower child mortality rates. The researcher may have asked this because s/he wanted to test the claim that that women's education may have an effect on child mortality rates. Therefore, women's education is the independent variable and child mortality rates is the dependent variable. 3. Independent (predictor) Variable (x) a. [dentify the Independent Variable (x): Write the name that you will use to label the independent variable in Excel. b. Describe and explain the independent variable in a complete sentence with units and years, if applicable. Use the wording from the data source. 4. Dependent (response) Variable (y) a. Identify the dependent variable (y): Write the name that you will use to label the dependent variable in Excel. b. Describe and explain the dependent variable in a complete sentence with units and years, if applicable. Use the wording from the data source. Submit this document and Excel file of your data (with three columns clearly labeled with name of the data point, independent variable with units, dependent variable with units) STATE Immigration Population in % |Crime rate (per 100k) Alabama 3.4 4,727 Alaska 8.2 5,389 Arizona 13.4 4,940 Arkansas 4.8 5,899 California 26.9 4,720 Colorado 9.5 6,091 Connecticut 14.61 3,312 Delaware 9.21 4,355 Virginia 12.5 3,121 Florida 21 3,922 Georgia 10.1 4,415 Hawaii 18.7 5,077 Idaho 6 2,466 Illinois 14.1 3,545 Indiana 5.3 3,924 lowa 5.5 3,700 Kansas 7.2 4,823 Kentucky 3.8 3,818Louisiana 4.2 6,408 Maine 3.5 2,421 Maryland 15.1 3,619 Massachusetts 17.4 2,415 Michigan 7 3,200 Minnesota 8.6 4,527 Mississippi 2.4 4,494 Missouri 4.2 5,605 New Jersey 22.8 2,512 Texas 17.2 4,937 New Hamsphire 6.1 2,344 New Mexico 9.5 6,462
Step by Step Solution
There are 3 Steps involved in it
Step: 1
Get Instant Access to Expert-Tailored Solutions
See step-by-step solutions with expert insights and AI powered tools for academic success
Step: 2
Step: 3
Ace Your Homework with AI
Get the answers you need in no time with our AI-driven, step-by-step assistance