

Answered step by step
Verified Expert Solution
Question
1 Approved Answer
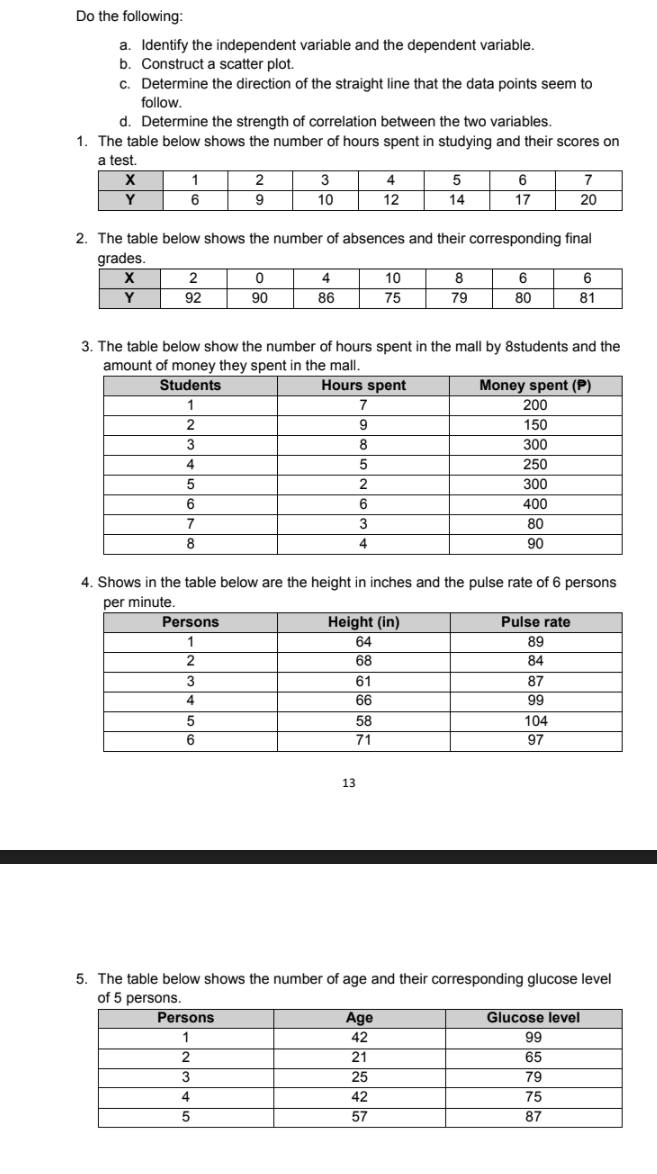
Do the following: a. Identify the independent variable and the dependent variable. b. Construct a scatter plot. c. Determine the direction of the straight line
Step by Step Solution
There are 3 Steps involved in it
Step: 1

Get Instant Access to Expert-Tailored Solutions
See step-by-step solutions with expert insights and AI powered tools for academic success
Step: 2

Step: 3
Ace Your Homework with AI
Get the answers you need in no time with our AI-driven, step-by-step assistance
Get Started
Intermediate Algebra
Authors: Marvin L Bittinger
11th Edition
0321968395, 9780321968395