Question
Do the following tasks (in exact sequence) using data given in HW6DataB and Table-2: B-1: Entropy. What do we measure from Entropy? What does it
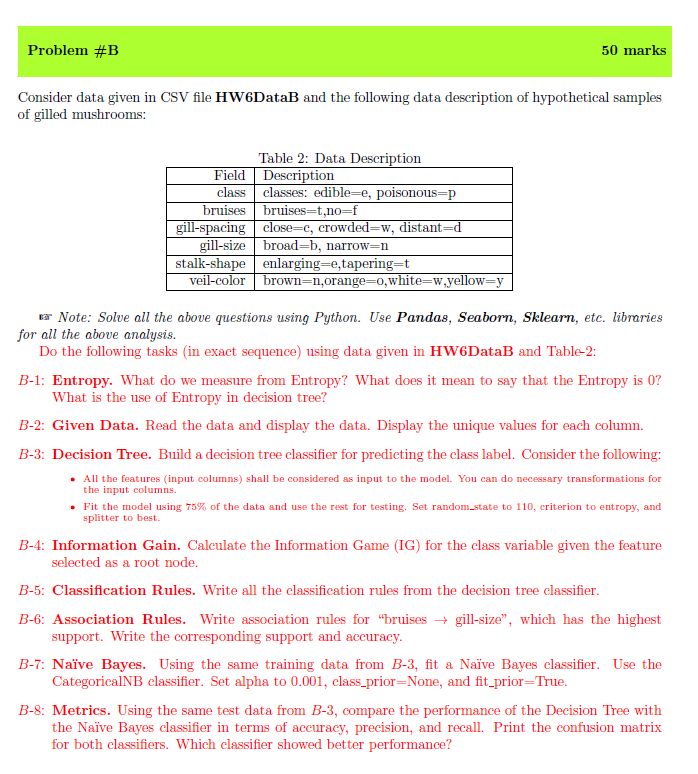
Do the following tasks (in exact sequence) using data given in HW6DataB and Table-2: B-1: Entropy. What do we measure from Entropy? What does it mean to say that the Entropy is 0? What is the use of Entropy in decision tree? B-2: Given Data. Read the data and display the data. Display the unique values for each column. B-3: Decision Tree. Build a decision tree classifier for predicting the class label. Consider the following: All the features (input columns) shall be considered as input to the model. You can do necessary transformations for the input columns. Fit the model using 75% of the data and use the rest for testing. Set random state to 110, criterion to entropy, and splitter to best. B-4: Information Gain. Calculate the Information Game (IG) for the class variable given the feature selected as a root node. B-5: Classification Rules. Write all the classification rules from the decision tree classifier. B-6: Association Rules. Write association rules for \bruises ! gill-size", which has the highest support. Write the corresponding support and accuracy. B-7: Naive Bayes. Using the same training data from B-3, fit a Naive Bayes classifier. Use the CategoricalNB classifier. Set alpha to 0.001, class prior=None, and fit prior=True. B-8: Metrics. Using the same test data from B-3, compare the performance of the Decision Tree with the Naive Bayes classifier in terms of accuracy, precision, and recall. Print the confusion matrix for both classifiers. Which classifier showed better performance?
------>>>Data:
| class | bruises | gill-spacing | gill-size | stalk-shape | veil-color |
| p | t | c | n | e | w |
| p | t | c | n | e | w |
| e | f | w | b | t | w |
| p | t | c | n | e | w |
| p | t | c | n | e | w |
| e | f | w | b | t | w |
| e | f | w | b | t | w |
| p | t | c | n | e | w |
| p | t | c | n | e | w |
| p | t | c | n | e | w |
| p | t | c | n | e | w |
| p | t | c | n | e | w |
| e | t | w | n | t | w |
| p | t | c | n | e | w |

Problem #B 50 marks Consider data given in CSV file HW6DataB and the following data description of hypothetical samples of gilled mushrooms: Table 2: Data Description Field Description class classes: edible=e, poisonous=p bruises bruisest,no=f gill-spacing close-c, crowded=w, distant=d gill-size broad=b, narrow=n stalk-shape enlarging=e,tapering=t veil-color brown=n,orange=0,white=w,yellow=y or Note: Solve all the above questions using Python. Use Pandas, Seaborn, Sklearn, etc. libraries for all the above analysis. Do the following tasks in exact sequence) using data given in HW6DataB and Table-2: B-1: Entropy. What do we measure from Entropy? What does it mean to say that the Entropy is 0? What is the use of Entropy in decision tree? B-2: Given Data. Read the data and display the data. Display the unique values for each column. B-3: Decision Tree. Build a decision tree classifier for predicting the class label. Consider the following: All the features (input columns) shall be considered as input to the model. You can do necessary transformations for the input columns Fit the model using 75% of the data and use the rest for testing. Set random-state to 110, criterion to entropy, and splitter to best. B-4: Information Gain. Calculate the Information Game (IG) for the class variable given the feature selected as a root node. B-5: Classification Rules. Write all the classification rules from the decision tree classifier. B-6: Association Rules. Write association rules for "bruises + gill-size", which has the highest support. Write the corresponding support and accuracy. B-7: Nave Bayes. Using the same training data from B-3, fit a Nave Bayes classifier. Use the CategoricalNB classifier. Set alpha to 0.001, class_prior=None, and fit_prior=True. B-8: Metrics. Using the same test data from B-3, compare the performance of the Decision Tree with the Nave Bayes classifier in terms of accuracy, precision, and recall. Print the confusion matrix for both classifiers. Which classifier showed better performance
Step by Step Solution
There are 3 Steps involved in it
Step: 1

Get Instant Access to Expert-Tailored Solutions
See step-by-step solutions with expert insights and AI powered tools for academic success
Step: 2

Step: 3

Ace Your Homework with AI
Get the answers you need in no time with our AI-driven, step-by-step assistance
Get Started


