

Answered step by step
Verified Expert Solution
Question
1 Approved Answer
Do the market ratios (financial analysis) for year 2018,2019,2020 : price earning ratio, market book ratio, financial leverage multiplier Particulars Note 2019-2020 Taka 2018-2019 Taka
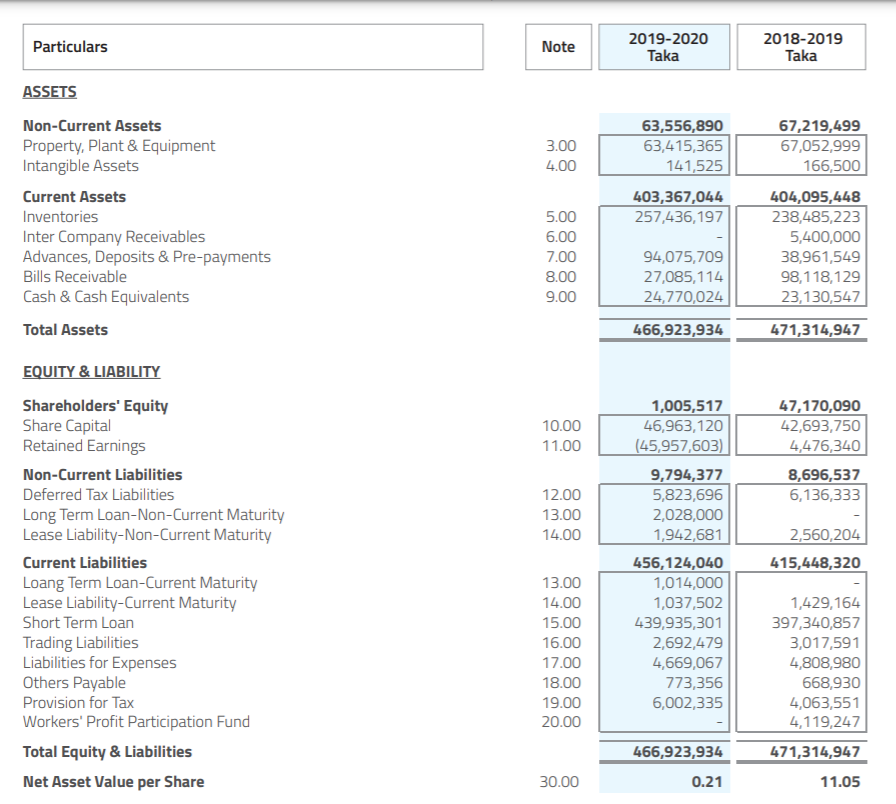
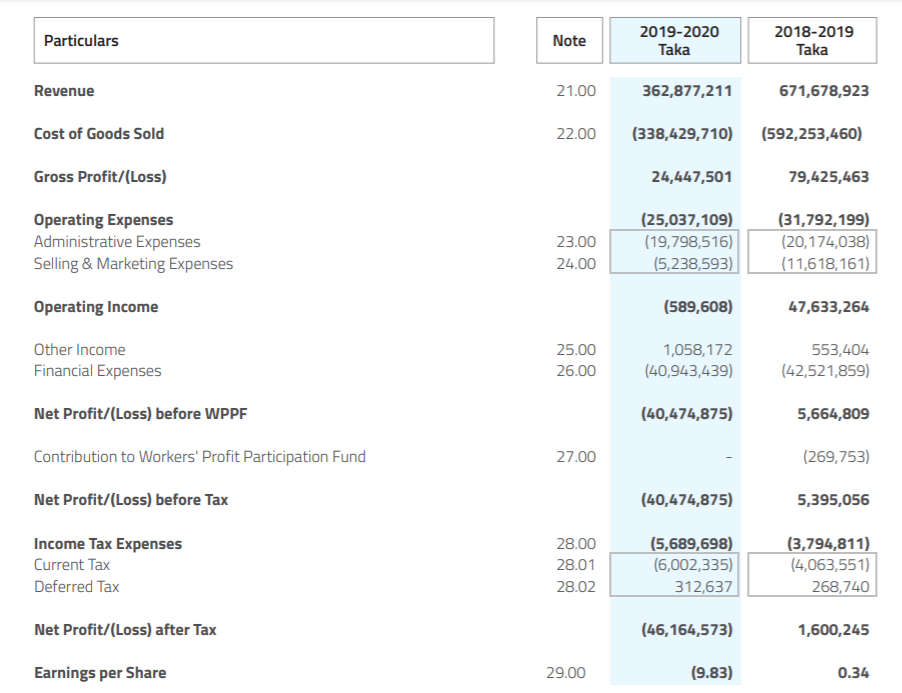
Do the market ratios (financial analysis) for year 2018,2019,2020 :
price earning ratio, market book ratio, financial leverage multiplier
Particulars Note 2019-2020 Taka 2018-2019 Taka 3.00 4.00 ASSETS Non-Current Assets Property, Plant & Equipment Intangible Assets Current Assets Inventories Inter Company Receivables Advances, Deposits & Pre-payments Bills Receivable Cash & Cash Equivalents Total Assets 63,556,890 63,415,365 141,525 403,367,044 257,436,197 5.00 6.00 7.00 8.00 9.00 67,219,499 67,052,999 166,500 404,095,448 238,485,223 5,400,000 38,961,549 98,118,129 23,130,547 94,075,709 27,085,114 24,770,024 466,923,934 471,314,947 10.00 11.00 47,170,090 42,693,750 4,476,340 8,696,537 6,136,333 12.00 13.00 14.00 EQUITY & LIABILITY Shareholders' Equity Share Capital Retained Earnings Non-Current Liabilities Deferred Tax Liabilities Long Term Loan-Non-Current Maturity Lease Liability-Non-Current Maturity Current Liabilities Loang Term Loan-Current Maturity Lease Liability-Current Maturity Short Term Loan Trading Liabilities Liabilities for Expenses Others Payable Provision for Tax Workers' Profit Participation Fund Total Equity & Liabilities Net Asset Value per Share 1,005,517 46,963,120 (45,957,603) 9,794,377 5,823,696 2,028,000 1,942,681 456,124,040 1,014,000 1,037,502 439,935,301 2,692,479 4,669,067 773,356 6,002,335 2,560,204 415,448,320 13.00 14.00 15.00 16.00 17.00 18.00 19.00 20.00 1,429,164 397,340,857 3,017,591 4,808,980 668,930 4,063,551 4,119,247 471,314,947 11.05 466,923,934 30.00 0.21 Particulars Note 2019-2020 Taka 2018-2019 Taka Revenue 21.00 362,877,211 671,678,923 Cost of Goods Sold 22.00 (338,429,710) (592,253,460) Gross Profit/(Loss) 24,447,501 79,425,463 Operating Expenses Administrative Expenses Selling & Marketing Expenses 23.00 24.00 (25,037,109) (19,798,516) (5,238,593) (31,792, 199) (20,174,038) (11,618,161) Operating Income (589,608) 47,633,264 Other Income Financial Expenses 25.00 26.00 1,058,172 (40,943,439) 553,404 (42,521,859) Net Profit/(Loss) before WPPE (40,474,875) 5,664,809 Contribution to Workers' Profit Participation Fund 27.00 (269,753) Net Profit/(Loss) before Tax (40,474,875) 5,395,056 Income Tax Expenses Current Tax Deferred Tax 28.00 28.01 28.02 (5,689,698) (6,002,335) 312,637 (3,794,811) (4,063,551) 268,740 Net Profit/(Loss) after Tax (46,164,573) 1,600,245 Earnings per Share 29.00 (9.83) 0.34 Particulars Note 2019-2020 Taka 2018-2019 Taka 3.00 4.00 ASSETS Non-Current Assets Property, Plant & Equipment Intangible Assets Current Assets Inventories Inter Company Receivables Advances, Deposits & Pre-payments Bills Receivable Cash & Cash Equivalents Total Assets 63,556,890 63,415,365 141,525 403,367,044 257,436,197 5.00 6.00 7.00 8.00 9.00 67,219,499 67,052,999 166,500 404,095,448 238,485,223 5,400,000 38,961,549 98,118,129 23,130,547 94,075,709 27,085,114 24,770,024 466,923,934 471,314,947 10.00 11.00 47,170,090 42,693,750 4,476,340 8,696,537 6,136,333 12.00 13.00 14.00 EQUITY & LIABILITY Shareholders' Equity Share Capital Retained Earnings Non-Current Liabilities Deferred Tax Liabilities Long Term Loan-Non-Current Maturity Lease Liability-Non-Current Maturity Current Liabilities Loang Term Loan-Current Maturity Lease Liability-Current Maturity Short Term Loan Trading Liabilities Liabilities for Expenses Others Payable Provision for Tax Workers' Profit Participation Fund Total Equity & Liabilities Net Asset Value per Share 1,005,517 46,963,120 (45,957,603) 9,794,377 5,823,696 2,028,000 1,942,681 456,124,040 1,014,000 1,037,502 439,935,301 2,692,479 4,669,067 773,356 6,002,335 2,560,204 415,448,320 13.00 14.00 15.00 16.00 17.00 18.00 19.00 20.00 1,429,164 397,340,857 3,017,591 4,808,980 668,930 4,063,551 4,119,247 471,314,947 11.05 466,923,934 30.00 0.21 Particulars Note 2019-2020 Taka 2018-2019 Taka Revenue 21.00 362,877,211 671,678,923 Cost of Goods Sold 22.00 (338,429,710) (592,253,460) Gross Profit/(Loss) 24,447,501 79,425,463 Operating Expenses Administrative Expenses Selling & Marketing Expenses 23.00 24.00 (25,037,109) (19,798,516) (5,238,593) (31,792, 199) (20,174,038) (11,618,161) Operating Income (589,608) 47,633,264 Other Income Financial Expenses 25.00 26.00 1,058,172 (40,943,439) 553,404 (42,521,859) Net Profit/(Loss) before WPPE (40,474,875) 5,664,809 Contribution to Workers' Profit Participation Fund 27.00 (269,753) Net Profit/(Loss) before Tax (40,474,875) 5,395,056 Income Tax Expenses Current Tax Deferred Tax 28.00 28.01 28.02 (5,689,698) (6,002,335) 312,637 (3,794,811) (4,063,551) 268,740 Net Profit/(Loss) after Tax (46,164,573) 1,600,245 Earnings per Share 29.00 (9.83) 0.34Step by Step Solution
There are 3 Steps involved in it
Step: 1

Get Instant Access to Expert-Tailored Solutions
See step-by-step solutions with expert insights and AI powered tools for academic success
Step: 2

Step: 3
Ace Your Homework with AI
Get the answers you need in no time with our AI-driven, step-by-step assistance
Get Started
Cryptocurrencies Decode How To Make Money With Bitcoin And Altcoins
Authors: Lynda Crew
1st Edition
979-8353774839