Do the math for each option.
*No explanation on the best option is needed, I just need help on math, Exhibit 7 has the costs listed, but I included them already in text below in parentheses:
1) Do not respond/maintain
- Match GM PT 6 yr/60k (N=66 L=96) corrosion 6/100k cost: (N=3 L=5) change from vehicle warranty to an owner warranty $100 deductible/transfer fee (not advertised)
- Exceed GMs terms: pt 7 yr/70k (N=86 L=135) corrosion 7/unlimited miles (N=5 L=7) for all coastal states and 6 yr/100k inland (N=3 L=5)
- Less than GM, equal to Crysler 5 yr/ 50k (Cost N=508 L=716)
5. Adopt European approach Basic pt 3 yr/36k N (Cost N=407) or 4 yr/50k (L=653) Corrosion 6 yr/100k
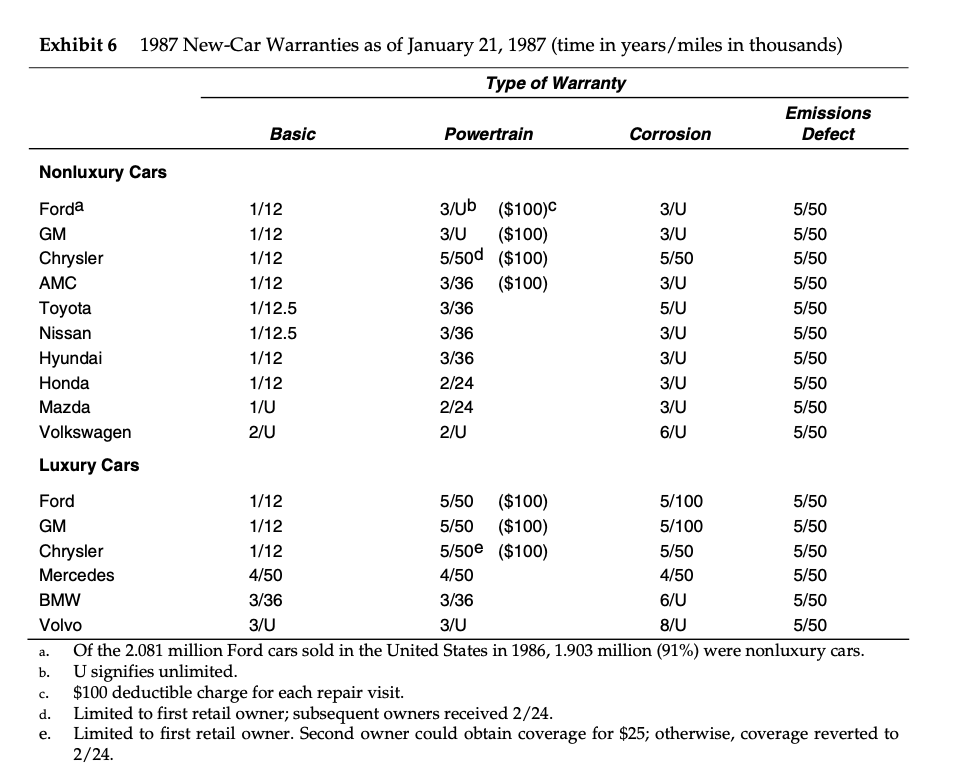
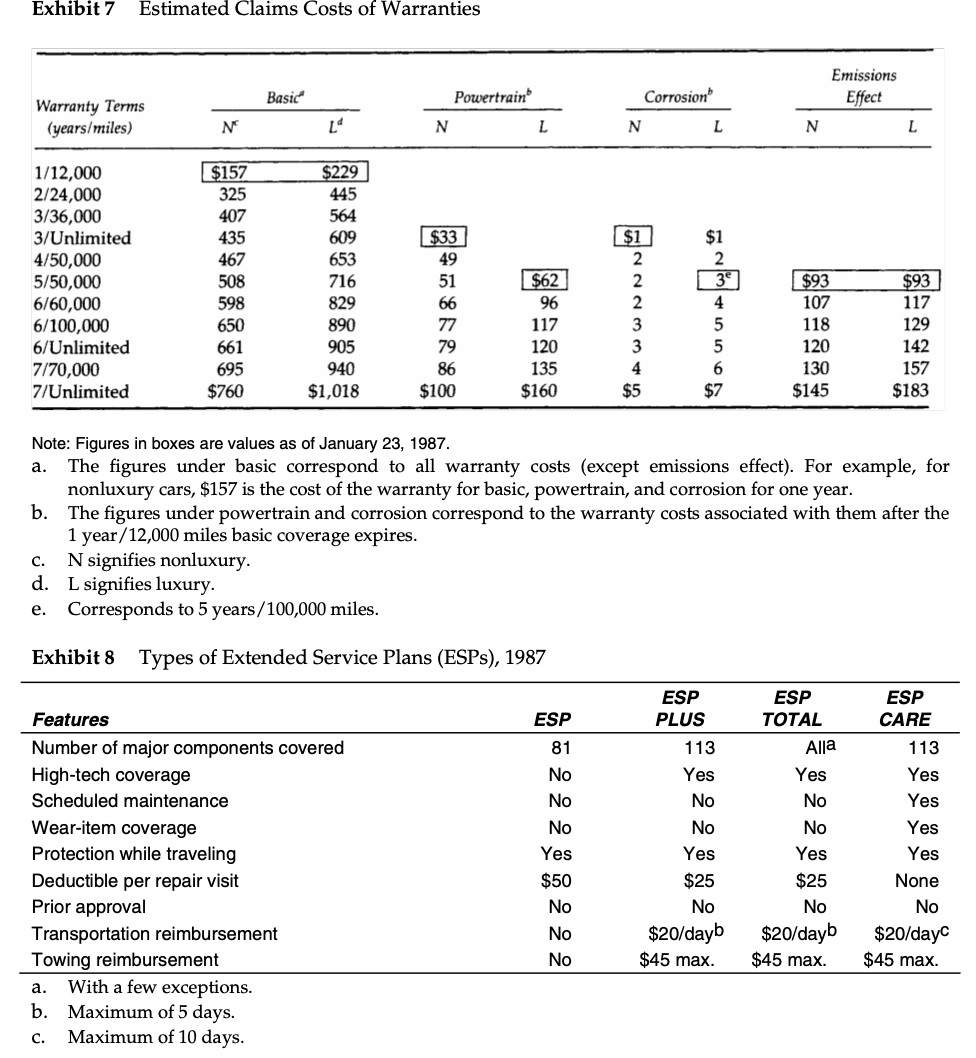
Exhibit 1 U.S. New-Car Production, Sales, and Market Shares (millions of units) Domestic Production Units Domestic Units % of Total Total Units 9.7 11.4 ON Year 1973 1974 1975 1976 1977 1978 1979 1980 1981 1982 1983 1984 1985 1986 9.7 7.3 6.7 8.5 9.2 9.2 8.4 6.4 6.3 8.8 8.6 10.1 11.2 11.3 7.4 7.0 8.6 9.1 9.3 8.3 6.6 6.2 5.8 6.8 Retail Sales Imports Units % of Total 1.7 14.9% 1.4 15.9 1.6 18.6 1.5 14.9 2.1 18.7 2.0 17.7 2.3 21.7 2.4 26.7 2.3 27.1 2.2 27.5 2.4 26.1 2.4 23.1 2.8 25.5 3.3 28.7% 85.1% 84.1 81.4 85.1 81.3 82.3 78.3 73.3 72.9 72.5 73.9 76.9 74.5 71.3% 10.6 9.0 8.5 5.1 6.8 7.8 8.2 8.0 8.2 8.0 9.2 10.4 11.0 11.5 7.8 8.2 Source: Ward's Automotive Yearbook, various years. Exhibit 2 U.S. Domestic Car Sales and Market Share by Size Category Subcompact Compact Intermediate Full-Size Luxury Overall 1,296,701 15.8% 2,562,588 31.2% 2,463,556 30.0% 1,077,308 13.2% 804,389 9.8% 8,204,542 100.0% 1985 unit sales 1985 share of industry 1986 unit sales 1986 share of industry 1,325,325 16.1% 2,461,192 30.0% 2,540,491 30.9% 1,115,789 13.6% 772,091 9.4% 8,214,888 100.0% 2,300,000 31.7% 2,200,000 30.4% 940,000 13.0% 650,000 9.0% 7,240,000 100.0% 20.9% 51.8 18.7 25.9% 64.0 9.8 23.1% 62.7 14.2 23.0% 77.0 25.3% 55.1 14.2 1987 unit salesa 1,150,000 1987 share of industrya 15.9% Breakdown of 1986 Sales by Competitor Ford 35.7% General Motors 25.0 Chrysler 22.5 American Motors 5.0 Volkswagen 5.5 Nissan 4.0 Honda 2.3 100.0% a. Expected. 0.3 0.9 0.9 0.6 8.6 100.0% 100 3.0 100.0% 100.0% 100.0% 100.0% Ford Motor Company: ine Product Warranty Program (A)589-001 -13- Exhibit 3 Competition in the U.S. Car Market Net Incomea ($ billions) Advertising Expenses ($ millions) U.S. Car Sales (000s of units) 1985 1986 Salesa ($ billions) 1985 1986 Share of U.S. Car Market (%) 1985 1986 18.8% 18.2% Number of Dealers 1986 1985 1986 1986 $648.5 Customer Profile, 1986 Loyalty Mean Family Female Levelsb Income Buyers (%) ($ thousands) (%) 46% $30.7 41% 61 34.6 41 45 30.6 43 n/a n/a n/a 35 36.3 50 42.5 41.0 839.0 11.3 11.4 426.0 1.2 0.7 5,460 9,680 4,023 1,349 1,079 1,113 407 862 116.2 5.6 5.5 208.8 5.2 4.8 29 33.6 47 180.1 a n/a 0.9 1.0 18 53.4 39 5.0 6.1 205.1 44 34.2 48 1.9 1.9 764 27 48 1.5 75 n/a Ford $52.77 $62.71 $2.51 $3.33 2,079 2,081 General Motors 96.37 102.81 4.00 2.93 4,692 4,693 Chrysler 21.26 22.59 1.64 1.40 1,245 1,309 AMC 4.04 3.46 (0.13) (0.09) 131 77 Toyota 24.35 38.21 1.24 1.55 620 634 Nissan 14.47 22.75 0.30 0.39 575 546 Volvo 13.58 13.24 1.02 1.02 104 113 Honda 10.59 16.36 0.52 0.82 552 694 Mazda 6.28 9.85 0.13 0.49 211 222 Hyundai na n/a n/a 169 Volkswagen 21.01 30.75 0.31 0.36 218 215 BMW 6.16 7.81 0.13 0.18 88 97 Mercedes-Benz 22.68 34.11 0.73 n/a 87 99 Subaru $2.69 $4.74 $0.60 $0.76 178 183 Others n/a n/a n/a n/a 258 319 Total 11,038 11,451 Note: n/a means not available. a. Sales and net income have been converted to U.S. dollars at the following rates: 1985 1986 Toyota, Nissan, Honda, Mazda, Subaru Y250 = $1 Y165 = $1 1 Volkswagen, BMW, Mercedes-Benz DM 2.31 = $1 DM 1.92 =$1 Volvo SEK 6.35 = $1 SEK 6.35 = $1 b. Percentage of owners who repurchase a new car from the same corporation. n/a 34.9 n/a a 41.3 2.0 156.8 n/a a $152.2 n/a a n/a 1.9 21 34 878 422 0.8 0.8 27 55.3 32 0.8 0.8 417 42% 80.0 33 1.6 1.6 n/a n/a n/a n/a 809 n/a 2.4 2.8 n/a n/a n/a na n/a n/a 100.0% 100.0% $33.8 43% a. Exhibit 4 (continued) 1981 1985 15% Psychographic Categories Driving enthusiast Loves cars Conspicuous consumer Socially aware Value conscious Economy-minded "America First" 10% 15 12 13 19 16 _15 100% 20 100% Note: The psychographic categories and the attitudes of the people they comprise are as follows: Driving enthusiast: Enjoys cars, especially the driving experience. Thinks imports have good quality and would not go out of his or her way to "Buy American." Has the strongest import orientation, particularly toward European cars, of any psychographic group. Loves cars: Regards his or her car as a possession to take pride in rather than as a driving experience. Considers car's styling extremely important. Tends to be outgoing. Conspicuous consumer: Engages in frequent trade-ins and brand switching. Likes to be the first to try new things and have all the latest options. Tends to like big, roomy, comfortable cars. Socially aware: Considers social issues important, tends to be politically liberal. Desires fuel-efficient cars and has no empathy for big Detroit cars. Favors inexpensive cars and believes imports are good. Value conscious: Tends not to be involved emotionally with cars or interested in them functionally. Appreciates a good value and favors Japanese cars. Economy-minded: Is interested in inexpensive and economical transportation. Tends to have conservative life-style. "America First": Says he or she will keep buying big, roomy cars as long as Detroit keeps making them. "Buys American" whenever possible. Does not think Japanese and German cars have better quality than U.S. cars. Has great interest in comfort and little interest in sports cars. Exhibit 5 Buying Process, 1986 Luxury Overall 4.8 5.4 58 34 59 43 56 46 Subcompact Compact Intermediate Full-Size Ownership cycle (years) 5.0 5.3 5.7 6.3 Median income ($000) 30 34 34 39 Median age (years) 32 42 60 61 Ford's loyalty rates 47 36 40 64 Major other brand(s) bought Japanese (28%) GM (32%) GM (43%) GM (30%) by Ford owners Chrysler (13%) Japanese (18%) Chrysler (9%) Owners of Other Makes Switching to Ford (%) GM 19a 10 8 10 Chrysler 13 11 16 22 Japanese 10 9 7 18 European 7 11 4 27 a. To be read: "Of GM owners buying a subcompact in 1986, 19% bought a Ford." GM (30%) European (14%) GM (25%) Japanese (15%) 10 18 12 14 9 5 2 9 Exhibit 6 1987 New-Car Warranties as of January 21, 1987 (time in years/miles in thousands) Type of Warranty Emissions Defect Basic Powertrain Corrosion Nonluxury Cars 3/U 5/50 3/U 5/50 Forda GM Chrysler AMC Toyota Nissan Hyundai Honda Mazda Volkswagen Luxury Cars 1/12 1/12 1/12 1/12 1/12.5 1/12.5 1/12 1/12 1/0 3/Ub ($100) 3/U ($100) 5/500 ($100) 3/36 ($100) 3/36 3/36 3/36 2/24 2/24 2/U 3/U 5/U 3/U 3/U 3/U 3/U 6/U 5/50 5/50 5/50 5/50 5/50 5/50 5/50 5/50 5/50 2/U Ford 1/12 5/50 ($100) 5/100 5/50 GM 1/12 5/50 ($100) 5/100 5/50 Chrysler 1/12 5/50e ($100) 5/50 5/50 Mercedes 4/50 4/50 4/50 5/50 BMW 3/36 3/36 6/U 5/50 Volvo 3/U 3/U 8/U 5/50 Of the 2.081 million Ford cars sold in the United States in 1986, 1.903 million (91%) were nonluxury cars. U signifies unlimited. $100 deductible charge for each repair visit. Limited to first retail owner; subsequent owners received 2/24. e. Limited to first retail owner. Second owner could obtain coverage for $25; otherwise, coverage reverted to 2/24. a. b. c. d. Exhibit 7 Estimated Claims Costs of Warranties Emissions Effect Basic Powertrain Corrosion Warranty Terms (years/miles) N L" N L N L N L 1/12,000 2/24,000 3/36,000 3/Unlimited 4/50,000 5/50,000 6/60,000 6/100,000 6/Unlimited 7/70,000 7/Unlimited $157 325 407 435 467 508 598 650 661 $229 445 564 609 653 no 716 829 890 905 940 $1,018 $33 49 51 66 77 79 86 $100 $62 96 117 120 135 $160 $1 2 2 2 3 3 4 $5 $1 2 3e 4 5 5 6 $7 $93 107 118 120 $93 117 129 142 695 130 157 $760 $145 $183 Note: Figures in boxes are values as of January 23, 1987. a. The figures under basic correspond to all warranty costs (except emissions effect). For example, for nonluxury cars, $157 is the cost of the warranty for basic, powertrain, and corrosion for one year. b. The figures under powertrain and corrosion correspond to the warranty costs associated with them after the 1 year/12,000 miles basic coverage expires. N signifies nonluxury. d. L signifies luxury. Corresponds to 5 years/100,000 miles. c. e. Exhibit 8 Types of Extended Service Plans (ESPs), 1987 ESP ESP CARE 113 81 Yes Yes Features Number of major components covered High-tech coverage Scheduled maintenance Wear-item coverage Protection while traveling Deductible per repair visit Prior approval Transportation reimbursement Towing reimbursement a. With a few exceptions. b. Maximum of 5 days. c. Maximum of 10 days. No Yes $50 Yes 3 3 3 3 3 3 3 3 ESP PLUS 113 Yes No No Yes $25 No $20/dayb $45 max. ESP TOTAL Alla Yes No No Yes $25 No $20/dayb $45 max. Yes None No $20/day $45 max. Exhibit 9 Extended Service Plans (ESPs): Sales and Profits ($ millions) 1986 1984 $140.2 47.8 1985 $195.0 82.0 $ 2.5 $265.4 117.5 $ 3.6 $ 1.6 417 669 Gross sales Lifetime profit before taxes Added parts profits Contract Volume (000s) New Ford Competitors Used Ford Competitors Others Total 540 7 5 12 160 120 63 209 814 83 239 1,029 210 110 _214 1,215 Exhibit 1 U.S. New-Car Production, Sales, and Market Shares (millions of units) Domestic Production Units Domestic Units % of Total Total Units 9.7 11.4 ON Year 1973 1974 1975 1976 1977 1978 1979 1980 1981 1982 1983 1984 1985 1986 9.7 7.3 6.7 8.5 9.2 9.2 8.4 6.4 6.3 8.8 8.6 10.1 11.2 11.3 7.4 7.0 8.6 9.1 9.3 8.3 6.6 6.2 5.8 6.8 Retail Sales Imports Units % of Total 1.7 14.9% 1.4 15.9 1.6 18.6 1.5 14.9 2.1 18.7 2.0 17.7 2.3 21.7 2.4 26.7 2.3 27.1 2.2 27.5 2.4 26.1 2.4 23.1 2.8 25.5 3.3 28.7% 85.1% 84.1 81.4 85.1 81.3 82.3 78.3 73.3 72.9 72.5 73.9 76.9 74.5 71.3% 10.6 9.0 8.5 5.1 6.8 7.8 8.2 8.0 8.2 8.0 9.2 10.4 11.0 11.5 7.8 8.2 Source: Ward's Automotive Yearbook, various years. Exhibit 2 U.S. Domestic Car Sales and Market Share by Size Category Subcompact Compact Intermediate Full-Size Luxury Overall 1,296,701 15.8% 2,562,588 31.2% 2,463,556 30.0% 1,077,308 13.2% 804,389 9.8% 8,204,542 100.0% 1985 unit sales 1985 share of industry 1986 unit sales 1986 share of industry 1,325,325 16.1% 2,461,192 30.0% 2,540,491 30.9% 1,115,789 13.6% 772,091 9.4% 8,214,888 100.0% 2,300,000 31.7% 2,200,000 30.4% 940,000 13.0% 650,000 9.0% 7,240,000 100.0% 20.9% 51.8 18.7 25.9% 64.0 9.8 23.1% 62.7 14.2 23.0% 77.0 25.3% 55.1 14.2 1987 unit salesa 1,150,000 1987 share of industrya 15.9% Breakdown of 1986 Sales by Competitor Ford 35.7% General Motors 25.0 Chrysler 22.5 American Motors 5.0 Volkswagen 5.5 Nissan 4.0 Honda 2.3 100.0% a. Expected. 0.3 0.9 0.9 0.6 8.6 100.0% 100 3.0 100.0% 100.0% 100.0% 100.0% Ford Motor Company: ine Product Warranty Program (A)589-001 -13- Exhibit 3 Competition in the U.S. Car Market Net Incomea ($ billions) Advertising Expenses ($ millions) U.S. Car Sales (000s of units) 1985 1986 Salesa ($ billions) 1985 1986 Share of U.S. Car Market (%) 1985 1986 18.8% 18.2% Number of Dealers 1986 1985 1986 1986 $648.5 Customer Profile, 1986 Loyalty Mean Family Female Levelsb Income Buyers (%) ($ thousands) (%) 46% $30.7 41% 61 34.6 41 45 30.6 43 n/a n/a n/a 35 36.3 50 42.5 41.0 839.0 11.3 11.4 426.0 1.2 0.7 5,460 9,680 4,023 1,349 1,079 1,113 407 862 116.2 5.6 5.5 208.8 5.2 4.8 29 33.6 47 180.1 a n/a 0.9 1.0 18 53.4 39 5.0 6.1 205.1 44 34.2 48 1.9 1.9 764 27 48 1.5 75 n/a Ford $52.77 $62.71 $2.51 $3.33 2,079 2,081 General Motors 96.37 102.81 4.00 2.93 4,692 4,693 Chrysler 21.26 22.59 1.64 1.40 1,245 1,309 AMC 4.04 3.46 (0.13) (0.09) 131 77 Toyota 24.35 38.21 1.24 1.55 620 634 Nissan 14.47 22.75 0.30 0.39 575 546 Volvo 13.58 13.24 1.02 1.02 104 113 Honda 10.59 16.36 0.52 0.82 552 694 Mazda 6.28 9.85 0.13 0.49 211 222 Hyundai na n/a n/a 169 Volkswagen 21.01 30.75 0.31 0.36 218 215 BMW 6.16 7.81 0.13 0.18 88 97 Mercedes-Benz 22.68 34.11 0.73 n/a 87 99 Subaru $2.69 $4.74 $0.60 $0.76 178 183 Others n/a n/a n/a n/a 258 319 Total 11,038 11,451 Note: n/a means not available. a. Sales and net income have been converted to U.S. dollars at the following rates: 1985 1986 Toyota, Nissan, Honda, Mazda, Subaru Y250 = $1 Y165 = $1 1 Volkswagen, BMW, Mercedes-Benz DM 2.31 = $1 DM 1.92 =$1 Volvo SEK 6.35 = $1 SEK 6.35 = $1 b. Percentage of owners who repurchase a new car from the same corporation. n/a 34.9 n/a a 41.3 2.0 156.8 n/a a $152.2 n/a a n/a 1.9 21 34 878 422 0.8 0.8 27 55.3 32 0.8 0.8 417 42% 80.0 33 1.6 1.6 n/a n/a n/a n/a 809 n/a 2.4 2.8 n/a n/a n/a na n/a n/a 100.0% 100.0% $33.8 43% a. Exhibit 4 (continued) 1981 1985 15% Psychographic Categories Driving enthusiast Loves cars Conspicuous consumer Socially aware Value conscious Economy-minded "America First" 10% 15 12 13 19 16 _15 100% 20 100% Note: The psychographic categories and the attitudes of the people they comprise are as follows: Driving enthusiast: Enjoys cars, especially the driving experience. Thinks imports have good quality and would not go out of his or her way to "Buy American." Has the strongest import orientation, particularly toward European cars, of any psychographic group. Loves cars: Regards his or her car as a possession to take pride in rather than as a driving experience. Considers car's styling extremely important. Tends to be outgoing. Conspicuous consumer: Engages in frequent trade-ins and brand switching. Likes to be the first to try new things and have all the latest options. Tends to like big, roomy, comfortable cars. Socially aware: Considers social issues important, tends to be politically liberal. Desires fuel-efficient cars and has no empathy for big Detroit cars. Favors inexpensive cars and believes imports are good. Value conscious: Tends not to be involved emotionally with cars or interested in them functionally. Appreciates a good value and favors Japanese cars. Economy-minded: Is interested in inexpensive and economical transportation. Tends to have conservative life-style. "America First": Says he or she will keep buying big, roomy cars as long as Detroit keeps making them. "Buys American" whenever possible. Does not think Japanese and German cars have better quality than U.S. cars. Has great interest in comfort and little interest in sports cars. Exhibit 5 Buying Process, 1986 Luxury Overall 4.8 5.4 58 34 59 43 56 46 Subcompact Compact Intermediate Full-Size Ownership cycle (years) 5.0 5.3 5.7 6.3 Median income ($000) 30 34 34 39 Median age (years) 32 42 60 61 Ford's loyalty rates 47 36 40 64 Major other brand(s) bought Japanese (28%) GM (32%) GM (43%) GM (30%) by Ford owners Chrysler (13%) Japanese (18%) Chrysler (9%) Owners of Other Makes Switching to Ford (%) GM 19a 10 8 10 Chrysler 13 11 16 22 Japanese 10 9 7 18 European 7 11 4 27 a. To be read: "Of GM owners buying a subcompact in 1986, 19% bought a Ford." GM (30%) European (14%) GM (25%) Japanese (15%) 10 18 12 14 9 5 2 9 Exhibit 6 1987 New-Car Warranties as of January 21, 1987 (time in years/miles in thousands) Type of Warranty Emissions Defect Basic Powertrain Corrosion Nonluxury Cars 3/U 5/50 3/U 5/50 Forda GM Chrysler AMC Toyota Nissan Hyundai Honda Mazda Volkswagen Luxury Cars 1/12 1/12 1/12 1/12 1/12.5 1/12.5 1/12 1/12 1/0 3/Ub ($100) 3/U ($100) 5/500 ($100) 3/36 ($100) 3/36 3/36 3/36 2/24 2/24 2/U 3/U 5/U 3/U 3/U 3/U 3/U 6/U 5/50 5/50 5/50 5/50 5/50 5/50 5/50 5/50 5/50 2/U Ford 1/12 5/50 ($100) 5/100 5/50 GM 1/12 5/50 ($100) 5/100 5/50 Chrysler 1/12 5/50e ($100) 5/50 5/50 Mercedes 4/50 4/50 4/50 5/50 BMW 3/36 3/36 6/U 5/50 Volvo 3/U 3/U 8/U 5/50 Of the 2.081 million Ford cars sold in the United States in 1986, 1.903 million (91%) were nonluxury cars. U signifies unlimited. $100 deductible charge for each repair visit. Limited to first retail owner; subsequent owners received 2/24. e. Limited to first retail owner. Second owner could obtain coverage for $25; otherwise, coverage reverted to 2/24. a. b. c. d. Exhibit 7 Estimated Claims Costs of Warranties Emissions Effect Basic Powertrain Corrosion Warranty Terms (years/miles) N L" N L N L N L 1/12,000 2/24,000 3/36,000 3/Unlimited 4/50,000 5/50,000 6/60,000 6/100,000 6/Unlimited 7/70,000 7/Unlimited $157 325 407 435 467 508 598 650 661 $229 445 564 609 653 no 716 829 890 905 940 $1,018 $33 49 51 66 77 79 86 $100 $62 96 117 120 135 $160 $1 2 2 2 3 3 4 $5 $1 2 3e 4 5 5 6 $7 $93 107 118 120 $93 117 129 142 695 130 157 $760 $145 $183 Note: Figures in boxes are values as of January 23, 1987. a. The figures under basic correspond to all warranty costs (except emissions effect). For example, for nonluxury cars, $157 is the cost of the warranty for basic, powertrain, and corrosion for one year. b. The figures under powertrain and corrosion correspond to the warranty costs associated with them after the 1 year/12,000 miles basic coverage expires. N signifies nonluxury. d. L signifies luxury. Corresponds to 5 years/100,000 miles. c. e. Exhibit 8 Types of Extended Service Plans (ESPs), 1987 ESP ESP CARE 113 81 Yes Yes Features Number of major components covered High-tech coverage Scheduled maintenance Wear-item coverage Protection while traveling Deductible per repair visit Prior approval Transportation reimbursement Towing reimbursement a. With a few exceptions. b. Maximum of 5 days. c. Maximum of 10 days. No Yes $50 Yes 3 3 3 3 3 3 3 3 ESP PLUS 113 Yes No No Yes $25 No $20/dayb $45 max. ESP TOTAL Alla Yes No No Yes $25 No $20/dayb $45 max. Yes None No $20/day $45 max. Exhibit 9 Extended Service Plans (ESPs): Sales and Profits ($ millions) 1986 1984 $140.2 47.8 1985 $195.0 82.0 $ 2.5 $265.4 117.5 $ 3.6 $ 1.6 417 669 Gross sales Lifetime profit before taxes Added parts profits Contract Volume (000s) New Ford Competitors Used Ford Competitors Others Total 540 7 5 12 160 120 63 209 814 83 239 1,029 210 110 _214 1,215


