Answered step by step
Verified Expert Solution
Question
1 Approved Answer
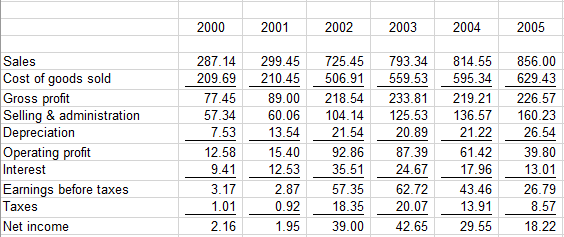
Do the standard set of analytics: common-size income statements. (could you calculate by hand we can not use excel for my course) 2000 2001 2002


Do the standard set of analytics: common-size income statements.
(could you calculate by hand we can not use excel for my course)
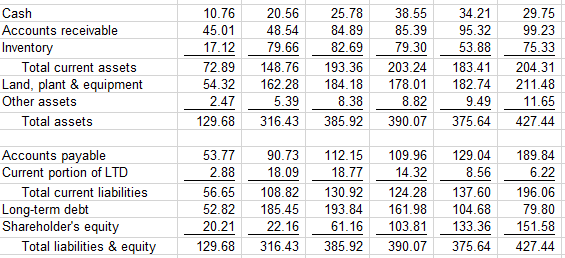
2000 2001 2002 2003 2004 2005 Sales Cost of goods sold Gross profit Selling & administration Depreciation Operating profit Interest Earnings before taxes Taxes Net income 287.14 209.69 77.45 57.34 7.53 12.58 9.41 3.17 1.01 2.16 299.45 210.45 89.00 60.06 13.54 15.40 12.53 2.87 0.92 1.95 725.45 506.91 218.54 104.14 21.54 92.86 35.51 57.35 18.35 39.00 793.34 559.53 233.81 125.53 20.89 87.39 24.67 62.72 20.07 42.65 814.55 595.34 219.21 136.57 21.22 61.42 17.96 43.46 13.91 29.55 856.00 629.43 226.57 160.23 26.54 39.80 13.01 26.79 8.57 18.22 Cash Accounts receivable Inventory Total current assets Land, plant & equipment Other assets Total assets 10.76 45.01 17.12 72.89 54.32 2.47 129.68 20.56 48.54 79.66 148.76 162.28 5.39 316.43 25.78 84.89 82.69 193.36 184.18 8.38 385.92 38.55 85.39 79.30 203.24 178.01 8.82 390.07 34.21 95.32 53.88 183.41 182.74 9.49 375.64 29.75 99.23 75.33 204.31 211.48 11.65 427.44 Accounts payable Current portion of LTD Total current liabilities Long-term debt Shareholder's equity Total liabilities & equity 53.77 2.88 56.65 52.82 20.21 129.68 90.73 18.09 108.82 185.45 22.16 316.43 112.15 18.77 130.92 193.84 61.16 385.92 109.96 14.32 124.28 161.98 103.81 390.07 129.04 8.56 137.60 104.68 133.36 375.64 189.84 6.22 196.06 79.80 151.58 427.44Step by Step Solution
There are 3 Steps involved in it
Step: 1

Get Instant Access to Expert-Tailored Solutions
See step-by-step solutions with expert insights and AI powered tools for academic success
Step: 2

Step: 3

Ace Your Homework with AI
Get the answers you need in no time with our AI-driven, step-by-step assistance
Get Started


