Answered step by step
Verified Expert Solution
Question
1 Approved Answer
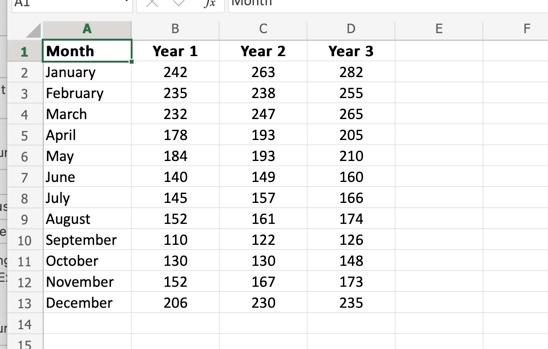
do working out please , thank you! begin{tabular}{|l|l|c|c|c|} hline multicolumn{1}{|c|}{} & multicolumn{1}{c|}{ A } & B & C & D hline multicolumn{1}{|l|}{} & Month
do working out please , thank you! 

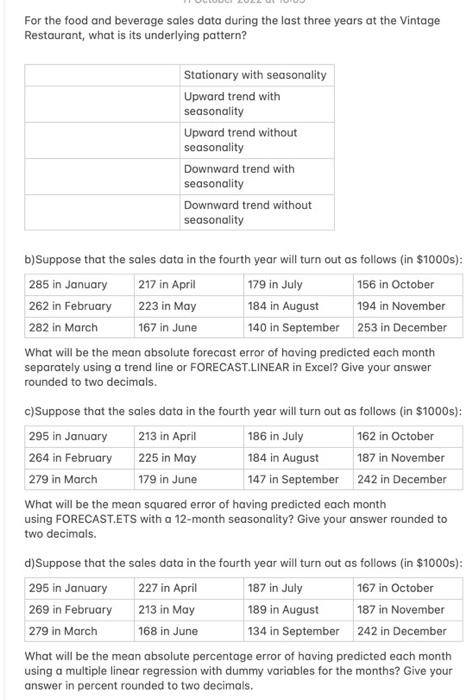
\begin{tabular}{|l|l|c|c|c|} \hline \multicolumn{1}{|c|}{} & \multicolumn{1}{c|}{ A } & B & C & D \\ \hline \multicolumn{1}{|l|}{} & Month & Year 1 & Year 2 & Year 3 \\ \hline 2 & January & 242 & 263 & 282 \\ \hline 3 & February & 235 & 238 & 255 \\ \hline 4 & March & 232 & 247 & 265 \\ \hline 5 & April & 178 & 193 & 205 \\ \hline 6 & May & 184 & 193 & 210 \\ \hline 7 & June & 140 & 149 & 160 \\ \hline 8 & July & 145 & 157 & 166 \\ \hline 9 & August & 152 & 161 & 174 \\ \hline 10 & September & 110 & 122 & 126 \\ \hline 11 & October & 130 & 130 & 148 \\ \hline 12 & November & 152 & 167 & 173 \\ \hline 13 & December & 206 & 230 & 235 \\ \hline 14 & & & \\ \hline 15 & & & \\ \hline \end{tabular} For the food and beverage sales data during the last three years at the Vintage Restaurant, what is its underlying pattern? b) Suppose that the sales data in the fourth year will turn out as follows (in $1000 s): What will be the mean absolute forecast error of having predicted each month separately using a trend line or FORECAST.LINEAR in Excel? Give your answer rounded to two decimals. c) Suppose that the sales data in the fourth year will turn out as follows (in $1000s ): What will be the mean squared error of having predicted each month using FORECAST.ETS with a 12-month seasonality? Give your answer rounded to two decimals. d)Suppose that the sales data in the fourth year will turn out as follows (in $1000 s): What will be the mean absolute percentage error of having predicted each month using a multiple linear regression with dummy variables for the months? Give your answer in percent rounded to two decimals. \begin{tabular}{|l|l|c|c|c|} \hline \multicolumn{1}{|c|}{} & \multicolumn{1}{c|}{ A } & B & C & D \\ \hline \multicolumn{1}{|l|}{} & Month & Year 1 & Year 2 & Year 3 \\ \hline 2 & January & 242 & 263 & 282 \\ \hline 3 & February & 235 & 238 & 255 \\ \hline 4 & March & 232 & 247 & 265 \\ \hline 5 & April & 178 & 193 & 205 \\ \hline 6 & May & 184 & 193 & 210 \\ \hline 7 & June & 140 & 149 & 160 \\ \hline 8 & July & 145 & 157 & 166 \\ \hline 9 & August & 152 & 161 & 174 \\ \hline 10 & September & 110 & 122 & 126 \\ \hline 11 & October & 130 & 130 & 148 \\ \hline 12 & November & 152 & 167 & 173 \\ \hline 13 & December & 206 & 230 & 235 \\ \hline 14 & & & \\ \hline 15 & & & \\ \hline \end{tabular} For the food and beverage sales data during the last three years at the Vintage Restaurant, what is its underlying pattern? b) Suppose that the sales data in the fourth year will turn out as follows (in $1000 s): What will be the mean absolute forecast error of having predicted each month separately using a trend line or FORECAST.LINEAR in Excel? Give your answer rounded to two decimals. c) Suppose that the sales data in the fourth year will turn out as follows (in $1000s ): What will be the mean squared error of having predicted each month using FORECAST.ETS with a 12-month seasonality? Give your answer rounded to two decimals. d)Suppose that the sales data in the fourth year will turn out as follows (in $1000 s): What will be the mean absolute percentage error of having predicted each month using a multiple linear regression with dummy variables for the months? Give your answer in percent rounded to two decimals 

Step by Step Solution
There are 3 Steps involved in it
Step: 1

Get Instant Access to Expert-Tailored Solutions
See step-by-step solutions with expert insights and AI powered tools for academic success
Step: 2

Step: 3

Ace Your Homework with AI
Get the answers you need in no time with our AI-driven, step-by-step assistance
Get Started


