Answered step by step
Verified Expert Solution
Link Copied!

Question

1 Approved Answer

Document: https://drive.google.com/file/d/12lvBb6V_O9a1THEJlOYblouC-Txvxbns/view?usp=sharing You will examine a data set that gives the number of words spoken in a day by 106 male and 116 female subjects

Document: https://drive.google.com/file/d/12lvBb6V_O9a1THEJlOYblouC-Txvxbns/view?usp=sharing

You will examine a data set that gives the number of words spoken in a day by 106 male and 116 female subjects aged 17 to 23.
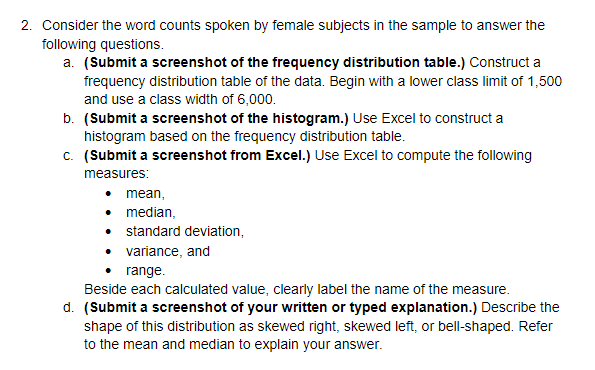
image text in transcribed
2. Consider the word counts spoken by female subjects in the sample to answer the following questions. a. (Submit a screenshot of the frequency distribution table.) Construct a frequency distribution table of the data. Begin with a lower class limit of 1,500 and use a class width of 6,000. b. (Submit a screenshot of the histogram.) Use Excel to construct a histogram based on the frequency distribution table. C. (Submit a screenshot from Excel.) Use Excel to compute the following measures: mean, median, standard deviation, variance, and range. Beside each calculated value, clearly label the name of the measure. d. ( Submit a screenshot of your written or typed explanation.) Describe the shape of this distribution as skewed right, skewed left, or bell-shaped. Refer to the mean and median to explain your

Step by Step Solution

There are 3 Steps involved in it

Step: 1

blur-text-image

Get Instant Access to Expert-Tailored Solutions

See step-by-step solutions with expert insights and AI powered tools for academic success

Step: 2

blur-text-image

Step: 3

blur-text-image

Ace Your Homework with AI

Get the answers you need in no time with our AI-driven, step-by-step assistance

Get Started

Recommended Textbook for

An Introduction to Measure Theoretic Probability

Authors: George G. Roussas

2nd edition

128000422, 978-0128000427

More Books

Students also viewed these Mathematics questions