Answered step by step
Verified Expert Solution
Question
1 Approved Answer
Document1 Q Search in Document Home Insert Design Layout References Mailings Review View 2+ Share Times New Ro... 11 A- A- A. A ** A+
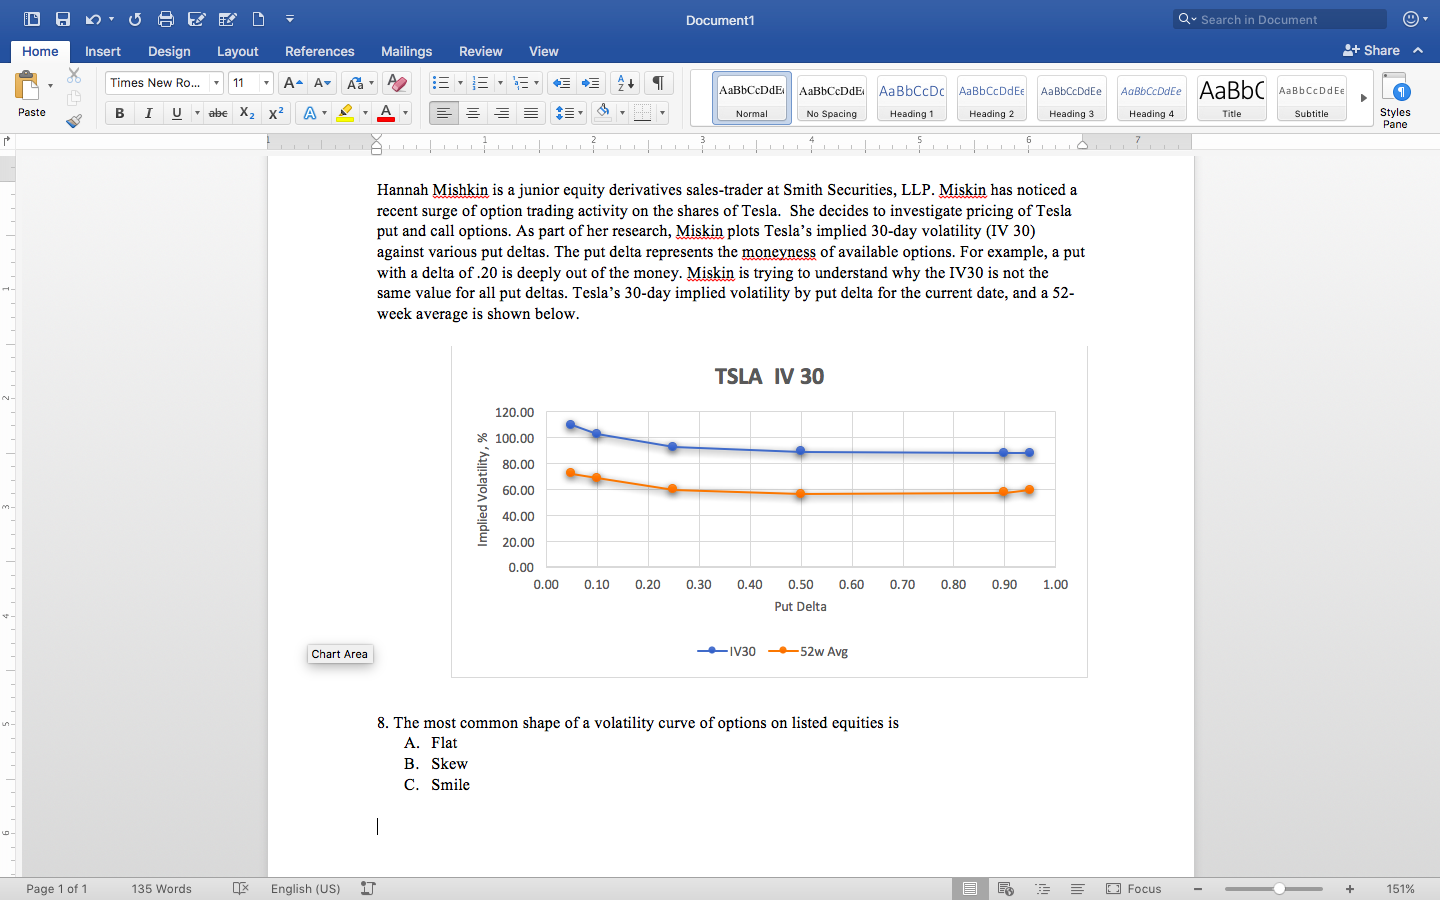
Document1 Q Search in Document Home Insert Design Layout References Mailings Review View 2+ Share Times New Ro... 11 A- A- A. A ** A+ AaBbCcDdE: AaBbCcDdE: AaBbCcDc AaBb CcDdEe AaBbCcDdEe AaBbccddie AaBb AaBbceDd Ee Paste B I Uabe Xx2 Normal No Spacing Heading 1 Heading 2 Heading 3 Heading 4 Title Subtitle Styles Pane filipili Hannah Mishkin is a junior equity derivatives sales-trader at Smith Securities, LLP. Miskin has noticed a recent surge of option trading activity on the shares of Tesla. She decides to investigate pricing of Tesla put and call options. As part of her research, Miskin plots Tesla's implied 30-day volatility (IV 30) against various put deltas. The put delta represents the moneyness of available options. For example, a put with a delta of 20 is deeply out of the money. Miskin is trying to understand why the IV30 is not the same value for all put deltas. Tesla's 30-day implied volatility by put delta for the current date, and a 52- week average is shown below. TSLA IV 30 120.00 de 100.00 80.00 Implied Volatility, % 60.00 40.00 20.00 0.00 0.00 0.10 0.20 0.30 0.40 0.50 0.60 0.70 0.80 0.90 1.00 Put Delta Chart Area -1V30-52w Avg 8. The most common shape of a volatility curve of options on listed equities is A. Flat B. Skew C. Smile Page 1 of 1 135 Words English (US) 1 D Focus + 151%
Step by Step Solution
There are 3 Steps involved in it
Step: 1
Get Instant Access to Expert-Tailored Solutions
See step-by-step solutions with expert insights and AI powered tools for academic success
Step: 2
Step: 3
Ace Your Homework with AI
Get the answers you need in no time with our AI-driven, step-by-step assistance
Get Started