Answered step by step
Verified Expert Solution
Link Copied!

Question

1 Approved Answer

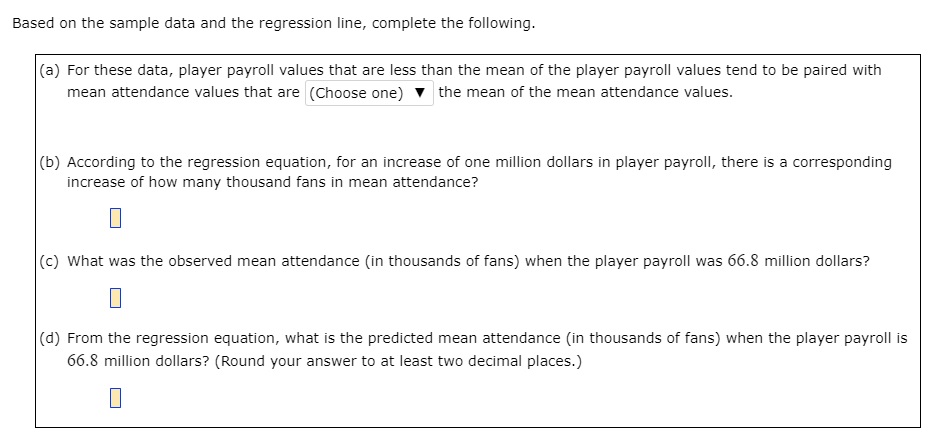
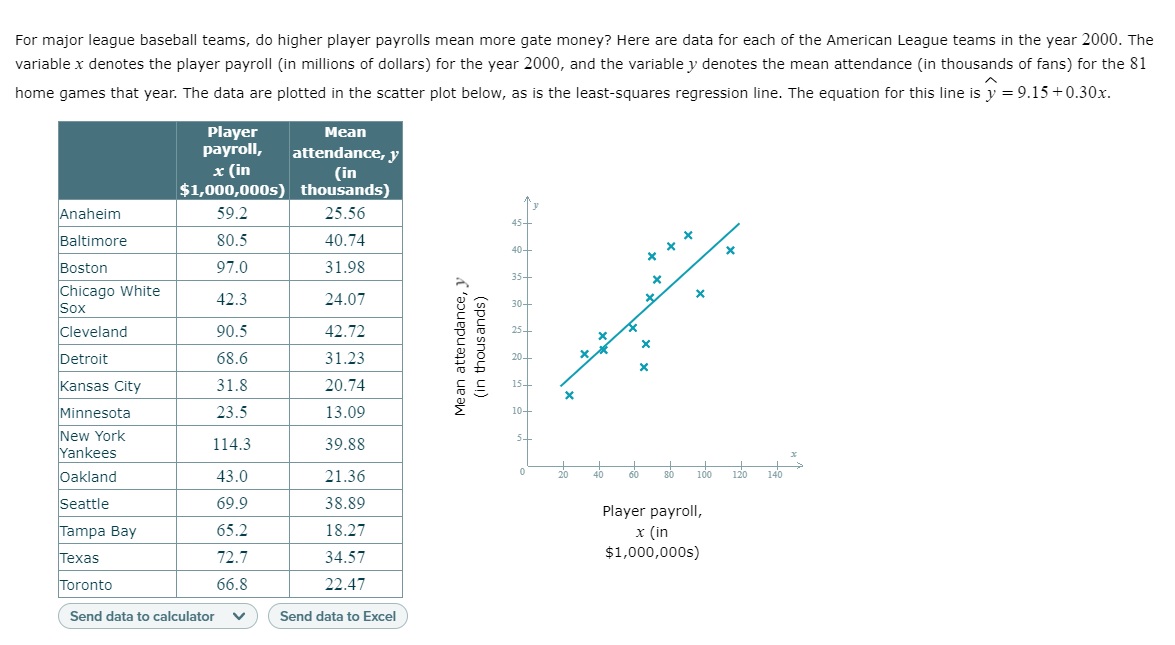
Does anyone have a formula to solve this problem? Based on the sample data and the regression line, complete the following. (a) For these data,

Does anyone have a formula to solve this problem?

image text in transcribedimage text in transcribed
Based on the sample data and the regression line, complete the following. (a) For these data, player payroll values that are less than the mean of the player payroll values tend to be paired with mean attendance values that are (Choose one) 1' the mean of the mean attendance values. (b) According to the regression equation, for an increase of one million dollars in player payroll, there is a corresponding increase of how many thousand fans in mean attendance? [I (c) what was the observed mean attendance [in thousands of fans) when the player payroll was 66.8 million dollars? I] (d) From the regression equation, what is the predicted mean attendance (in thousands of fans) when the player payroll is 66.8 million dollars? (Round your answer to at least two decimal places.) I] For major league baseball teams, do higher player payrolls mean more gate money? Here are data for each of the American League teams in the year 2000. The variable x denotes the player payroll (in millions of dollars) for the year 2000, and the variable y denotes the mean attendance (in thousands of fans) for the 81 home games that year. The data are plotted in the scatter plot below, as is the least-squares regression line. The equation for this line is y = 9.15 +0.30x. Player Mean payroll, attendance, y x (in (in $1,000,000s) thousands) Anaheim 59.2 25.56 45- Baltimore 80.5 40.74 40- X Boston 97.0 31.98 35- Chicago White 42.3 Sox 24.07 X 30- Cleveland 90.5 42.72 25- X (in thousands) Mean attendance, y X Detroit 68.6 31.23 20- X Kansas City 31.8 20.74 Minnesota 23.5 13.09 10- New York Yankees 114.3 39.88 Oakland 43.0 21.36 20 40 60 100 120 140 Seattle 69.9 38.89 Player payroll, Tampa Bay 65.2 18.27 x (in Texas 72.7 34.57 $1,000,000s) Toronto 66.8 22.47 Send data to calculator v Send data to Excel

Step by Step Solution

There are 3 Steps involved in it

Step: 1

blur-text-image

Get Instant Access to Expert-Tailored Solutions

See step-by-step solutions with expert insights and AI powered tools for academic success

Step: 2

blur-text-image

Step: 3

blur-text-image

Ace Your Homework with AI

Get the answers you need in no time with our AI-driven, step-by-step assistance

Get Started

Recommended Textbook for

Differential Equations A Maple™ Supplement

Authors: Robert P Gilbert, George C Hsiao, Robert J Ronkese

2nd Edition

1000402525, 9781000402520

More Books

Students also viewed these Mathematics questions