

Question
Does anyone know how to solve the SPSs questions in measurement and evaluation in human performance book!? please help me.... if you can explain how
Does anyone know how to solve the SPSs questions in measurement and evaluation in human performance book!?
please help me.... if you can explain how to solve this question in SPSS program .. let me know the answer like this
How to solve this question in SPSS
PLEASE explain like this
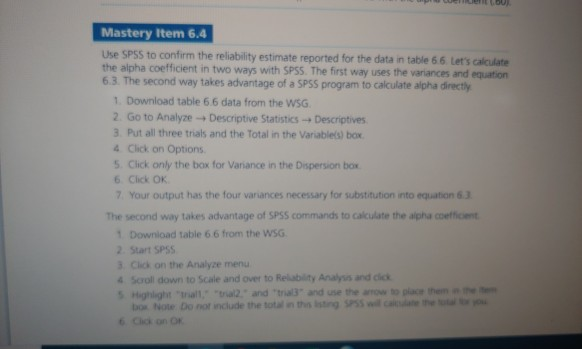
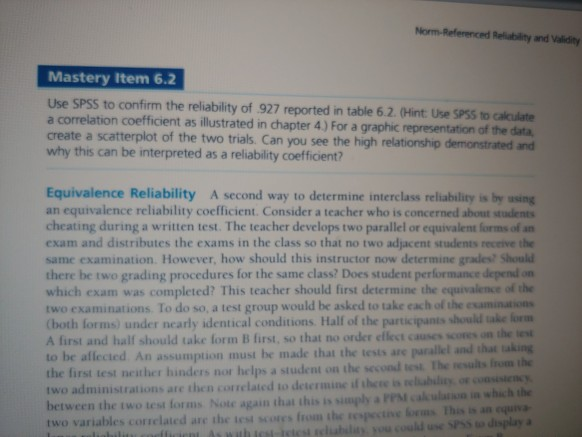
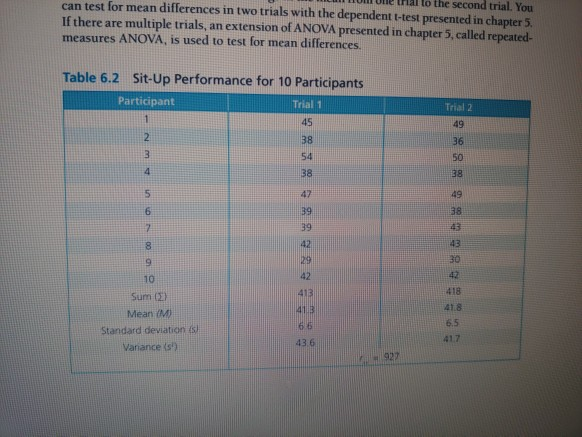
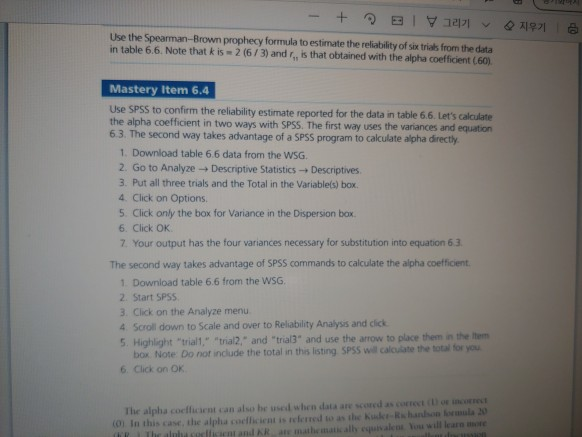
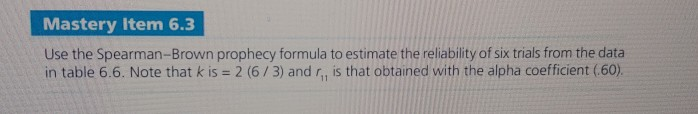
Norm Referenced Reliability and validity Mastery Item 6.2 Use SPSS to confirm the reliability of 927 reported in table 6.2. (Hint Use SPSS to calculate a correlation coefficient as illustrated in chapter 4) For a graphic representation of the data, create a scatterplot of the two trials. Can you see the high relationship demonstrated and why this can be interpreted as a reliability coefficient? Equivalence Reliability A second way to determine interclass reliability is by using an equivalence reliability coefficient. Consider a teacher who is concerned about students cheating during a written test. The teacher develops two parallel or equivalent forms of an exam and distributes the exams in the class so that no two adjacent students receive the same examination. However, how should this instructor now determine grades? Should there be two grading procedures for the same class? Does student performance depend on which exam was completed? This teacher should first determine the equivalence of the two examinations. To do so, a test group would be asked to take each of the examinations (both forms) under nearly identical conditions. Half of the participants should take form A first and half should take form B first, so that no order ellect causes scores on the test to be affected. An assumption must be made that the tests are parallel and that taking the first test neither hinders nor helps a student on the second test. The results from the two administrations are the correlated to determine if there is real or cancy between the two test forms Note again that this is simply a cak in which the two variables correlated are the test scores from the respective forms. This is an equa shtetestability you could use to display a to the second trial. You can test for mean differences in two trials with the dependent t-test presented in chapter 5. If there are multiple trials, an extension of ANOVA presented in chapter 5, called repeated- measures ANOVA, is used to test for mean differences Table 6.2 Sit-Up Performance for 10 Participants Participant Trial 1 1 Trial 2 49 45 2 3 38 54 38 36 50 38 4 5 47 49 58 6 2 39 39 42 29 8 43 30 418 9 10 Sum (2) Mean Mo Standard deviation Vanances 413 413 65 436 418 6.5 927 + EI12121 Use the Spearman-Brown prophecy formula to estimate the reliability of six trials from the data in table 6.6. Note that kis = 2(6/3) andr,, is that obtained with the alpha coefficient (60). Mastery Item 6.4 Use SPSS to confirm the reliability estimate reported for the data in table 6.6. Let's calculate the alpha coefficient in two ways with SPSS. The first way uses the variances and equation 63. The second way takes advantage of a SPSS program to calculate alpha directly 1. Download table 6.6 data from the WSG. 2. Go to Analyze - Descriptive Statistics Descriptives 3. Put all three trials and the Total in the variable(s) box. 4. Click on Options 5. Click only the box for Variance in the Dispersion box 6. Click OK 7. Your output has the four variances necessary for substitution into equation 6.3 The second way takes advantage of SPSS commands to calculate the alpha coefficient 1. Download table 6.6 from the WSG 2. Start SPSS 3. Click on the Analyze menu 4. Scroll down to scale and over to Reliability Analysis and click 5. Highlight "trial1," "trial," and "trial" and use the arrow to place them in the tem box Note Do not include the total in this listing SPSS will calculate the total for you 6. Click on OK The alpha coefficient can also be used when data are scored a corrector (OL In this case, the alpha coefficient is referred to as the hand formula 20 The alla sortient and mathematical equivalents will learn Mastery Item 6.3 Use the Spearman-Brown prophecy formula to estimate the reliability of six trials from the data in table 6.6. Note that kis = 2 (673) and r, is that obtained with the alpha coefficient (60). Mastery Item 6.4 Use SPSS to confirm the reliability estimate reported for the data in table 6 6 Let's calculate the alpha coefficient in two ways with SPSS. The first way uses the variances and equation 6.3. The second way takes advantage of a SPSS program to calculate alpha directly 1. Download table 6.6 data from the WSG 2. Go to Analyze + Descriptive Statistics -- Descriptives 3. Put all three trials and the Total in the Variable(s) box 4. Click on Options 5. Click only the box for Variance in the Dispersion box 6 Click OK 7. Your output has the four variances necessary for substitution into equation 6.3. The second way takes advantage of SPSS commands to calculate the alpha coefficient 1 Download table 6 6 from the WSG 2. Start SPSS Click on the Analyze menu 4. Scroll down to scale and over to Reliability Analysis and click 5. Highlight that "2" and "B" and use the arrow to place them box Note Do not include the total in this sting anh 6 Click on on Norm Referenced Reliability and validity Mastery Item 6.2 Use SPSS to confirm the reliability of 927 reported in table 6.2. (Hint Use SPSS to calculate a correlation coefficient as illustrated in chapter 4) For a graphic representation of the data, create a scatterplot of the two trials. Can you see the high relationship demonstrated and why this can be interpreted as a reliability coefficient? Equivalence Reliability A second way to determine interclass reliability is by using an equivalence reliability coefficient. Consider a teacher who is concerned about students cheating during a written test. The teacher develops two parallel or equivalent forms of an exam and distributes the exams in the class so that no two adjacent students receive the same examination. However, how should this instructor now determine grades? Should there be two grading procedures for the same class? Does student performance depend on which exam was completed? This teacher should first determine the equivalence of the two examinations. To do so, a test group would be asked to take each of the examinations (both forms) under nearly identical conditions. Half of the participants should take form A first and half should take form B first, so that no order ellect causes scores on the test to be affected. An assumption must be made that the tests are parallel and that taking the first test neither hinders nor helps a student on the second test. The results from the two administrations are the correlated to determine if there is real or cancy between the two test forms Note again that this is simply a cak in which the two variables correlated are the test scores from the respective forms. This is an equa shtetestability you could use to display a to the second trial. You can test for mean differences in two trials with the dependent t-test presented in chapter 5. If there are multiple trials, an extension of ANOVA presented in chapter 5, called repeated- measures ANOVA, is used to test for mean differences Table 6.2 Sit-Up Performance for 10 Participants Participant Trial 1 1 Trial 2 49 45 2 3 38 54 38 36 50 38 4 5 47 49 58 6 2 39 39 42 29 8 43 30 418 9 10 Sum (2) Mean Mo Standard deviation Vanances 413 413 65 436 418 6.5 927 + EI12121 Use the Spearman-Brown prophecy formula to estimate the reliability of six trials from the data in table 6.6. Note that kis = 2(6/3) andr,, is that obtained with the alpha coefficient (60). Mastery Item 6.4 Use SPSS to confirm the reliability estimate reported for the data in table 6.6. Let's calculate the alpha coefficient in two ways with SPSS. The first way uses the variances and equation 63. The second way takes advantage of a SPSS program to calculate alpha directly 1. Download table 6.6 data from the WSG. 2. Go to Analyze - Descriptive Statistics Descriptives 3. Put all three trials and the Total in the variable(s) box. 4. Click on Options 5. Click only the box for Variance in the Dispersion box 6. Click OK 7. Your output has the four variances necessary for substitution into equation 6.3 The second way takes advantage of SPSS commands to calculate the alpha coefficient 1. Download table 6.6 from the WSG 2. Start SPSS 3. Click on the Analyze menu 4. Scroll down to scale and over to Reliability Analysis and click 5. Highlight "trial1," "trial," and "trial" and use the arrow to place them in the tem box Note Do not include the total in this listing SPSS will calculate the total for you 6. Click on OK The alpha coefficient can also be used when data are scored a corrector (OL In this case, the alpha coefficient is referred to as the hand formula 20 The alla sortient and mathematical equivalents will learn Mastery Item 6.3 Use the Spearman-Brown prophecy formula to estimate the reliability of six trials from the data in table 6.6. Note that kis = 2 (673) and r, is that obtained with the alpha coefficient (60). Mastery Item 6.4 Use SPSS to confirm the reliability estimate reported for the data in table 6 6 Let's calculate the alpha coefficient in two ways with SPSS. The first way uses the variances and equation 6.3. The second way takes advantage of a SPSS program to calculate alpha directly 1. Download table 6.6 data from the WSG 2. Go to Analyze + Descriptive Statistics -- Descriptives 3. Put all three trials and the Total in the Variable(s) box 4. Click on Options 5. Click only the box for Variance in the Dispersion box 6 Click OK 7. Your output has the four variances necessary for substitution into equation 6.3. The second way takes advantage of SPSS commands to calculate the alpha coefficient 1 Download table 6 6 from the WSG 2. Start SPSS Click on the Analyze menu 4. Scroll down to scale and over to Reliability Analysis and click 5. Highlight that "2" and "B" and use the arrow to place them box Note Do not include the total in this sting anh 6 Click on on
Step by Step Solution
There are 3 Steps involved in it
Step: 1

Get Instant Access to Expert-Tailored Solutions
See step-by-step solutions with expert insights and AI powered tools for academic success
Step: 2

Step: 3
Ace Your Homework with AI
Get the answers you need in no time with our AI-driven, step-by-step assistance
Get Started
Guide On Marketing Audit Start Conducting A Successful Marketing Audit
Authors: Milly Anecelle
1st Edition
B0BM429R34, 979-8363321580